Optimizing Interaction to Next Paint Jeremy Wagner — jlwagner.net — @malchata — Armada JS Thank you everyone for coming to my talk. My name is Jeremy Wagner and I’m a technical writer at Google for Chrome, focusing on web performance and Core Web Vitals. I’m stoked to be here in Novi Sad to give this talk about a new responsiveness metric we’ve been working on at Google called Interaction to Next Paint—or INP for short. So—let’s get rolling!
Slide 1
Slide 2
What is responsiveness? Before we can get into INP, we need to clarify “responsiveness”. When we talk about “responsiveness”, we’re talking about how quickly a user interface responds to user input.
Slide 3
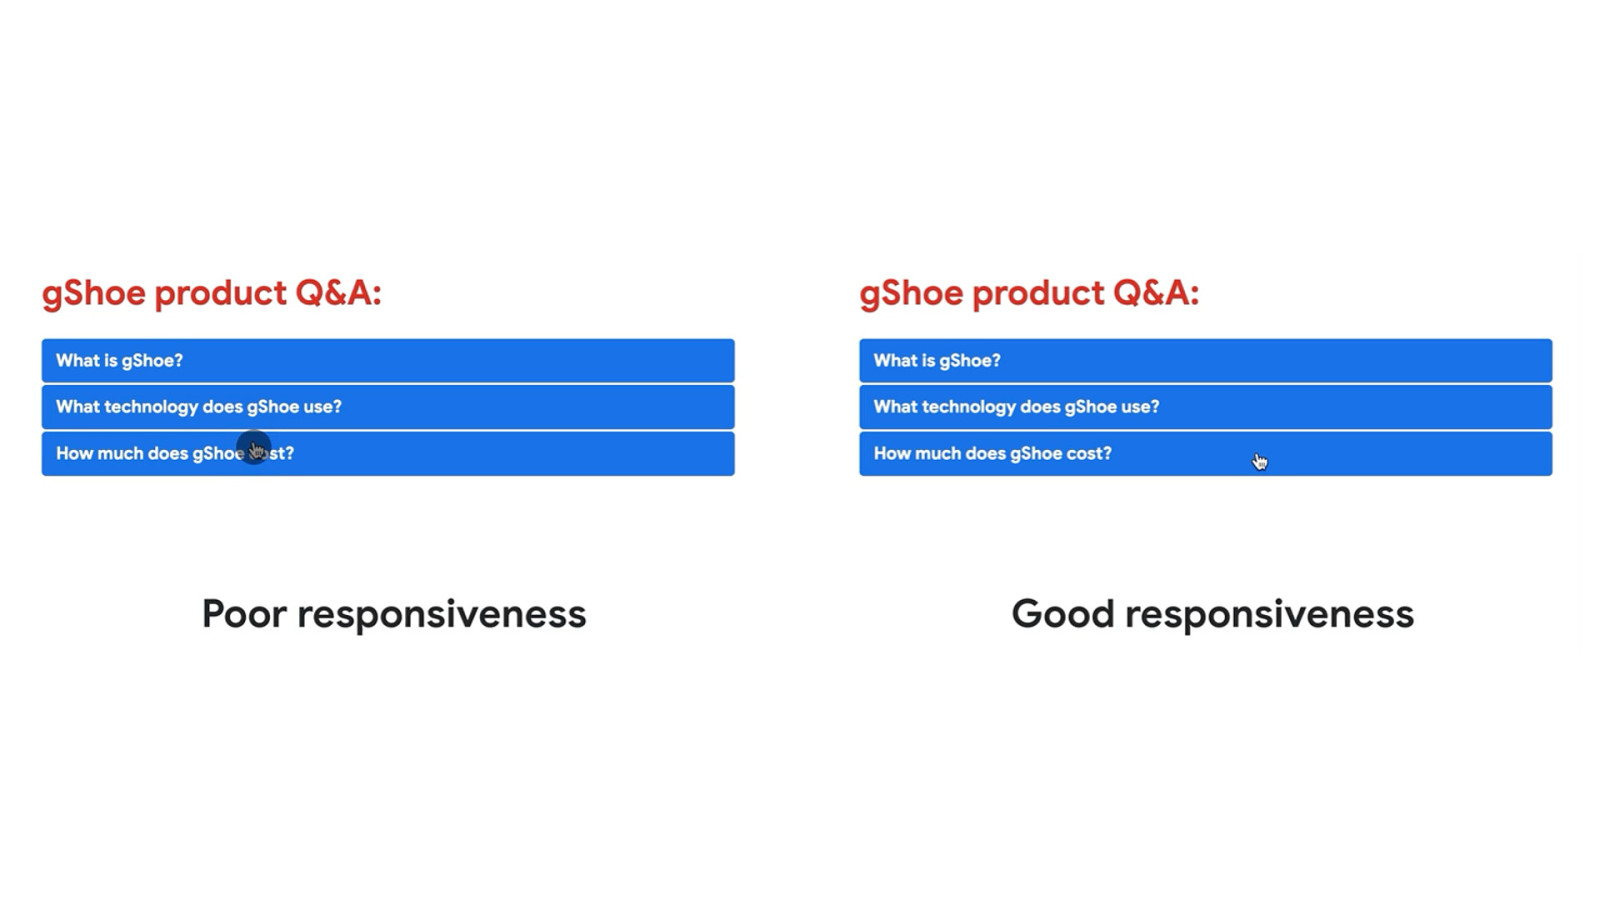
You’ve almost certainly experienced poor responsiveness. It occurs when you interact with something on the page, but the visual feedback of that interaction is signi cantly delayed. Poor responsiveness makes a page seem unreliable. This unreliability means you may tap multiple times on a page element, causing multiple unintended inputs—or worse, no response at all. fi We want good responsiveness, because it gives a sense that a page is reliable.
Slide 4
What causes poor responsiveness? So, what causes poor responsiveness? To answer that, we need to talk about tasks.
Slide 5
In order for a web page to provide a user experience, a web browser must orchestrate a lot of work. To do that, it uses threads. The most important of these is the main thread. It’s where most work occurs—including the work your JavaScript code queues up.
Slide 6
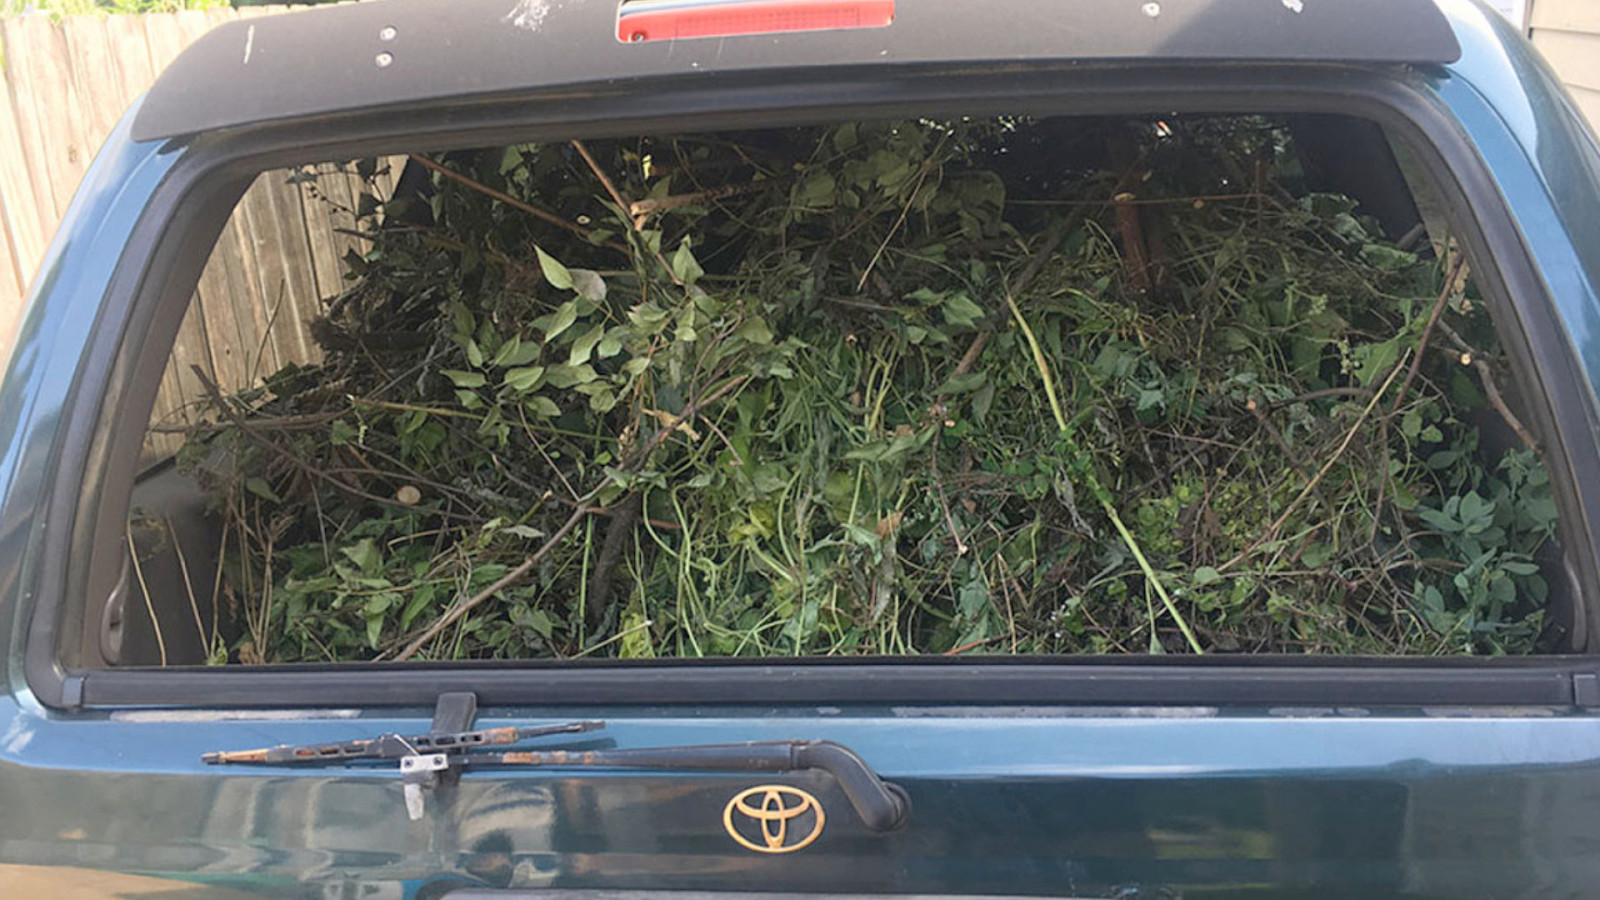
ff You don’t want your main thread to look like this, stu ed to the brim with tasks that are always running, constantly blocking user input, and making your pages slow and unable to respond quickly.
Slide 7
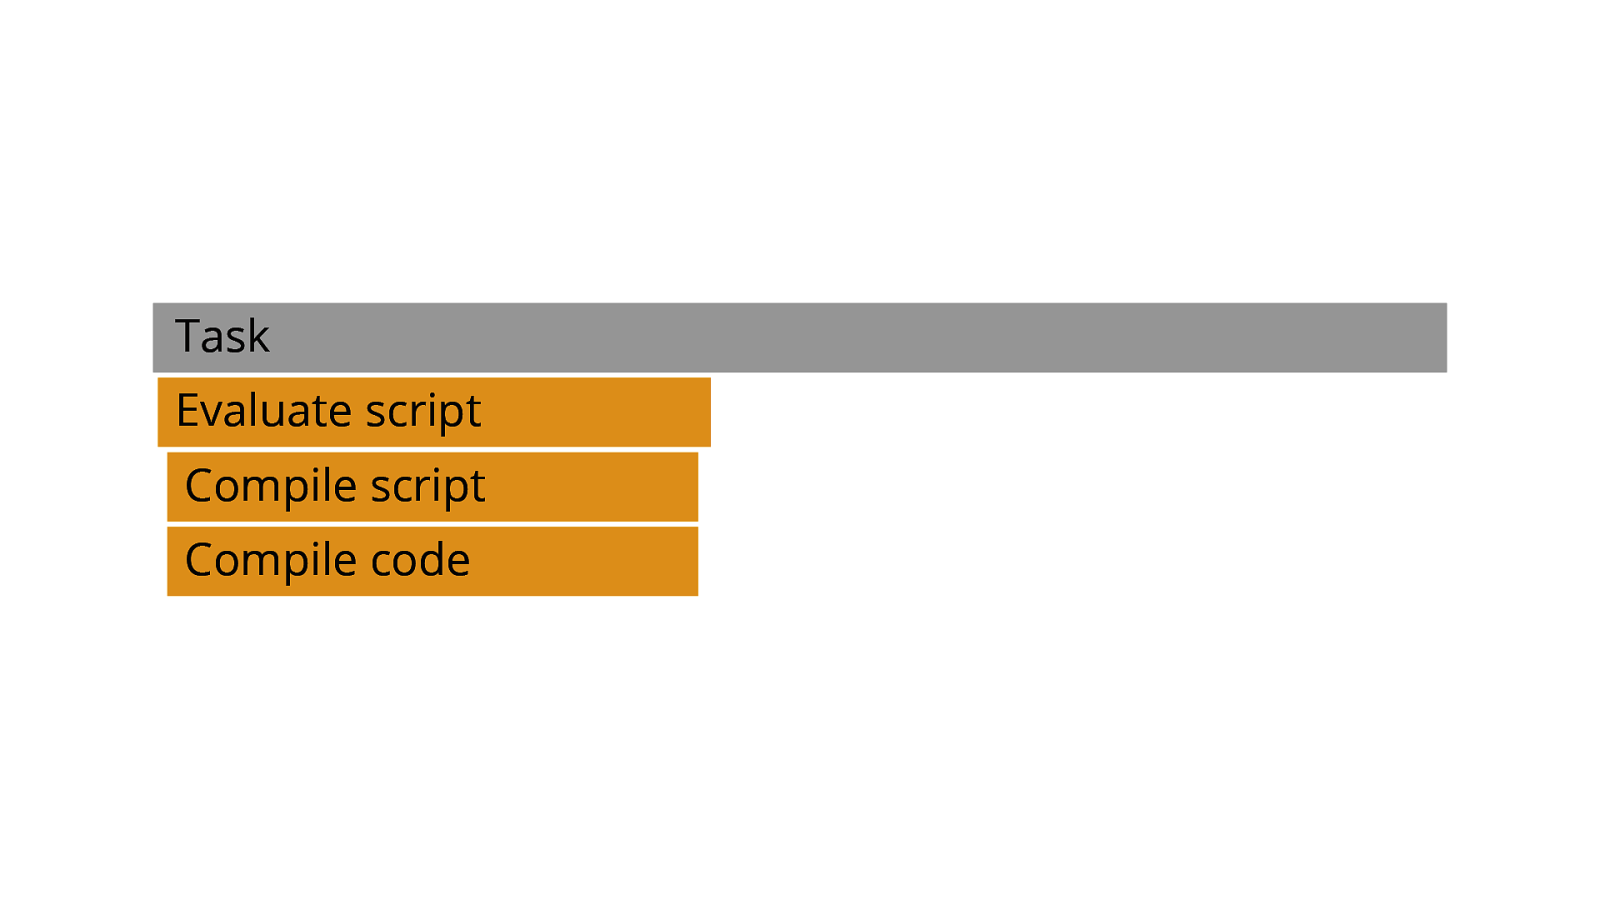
Back to the topic of tasks… A task is a discrete piece of activity that the browser runs—again, usually on the main thread. [ADVANCE] fi In this speci c case, we see that activity consists of script evaluation and compilation.
Slide 8
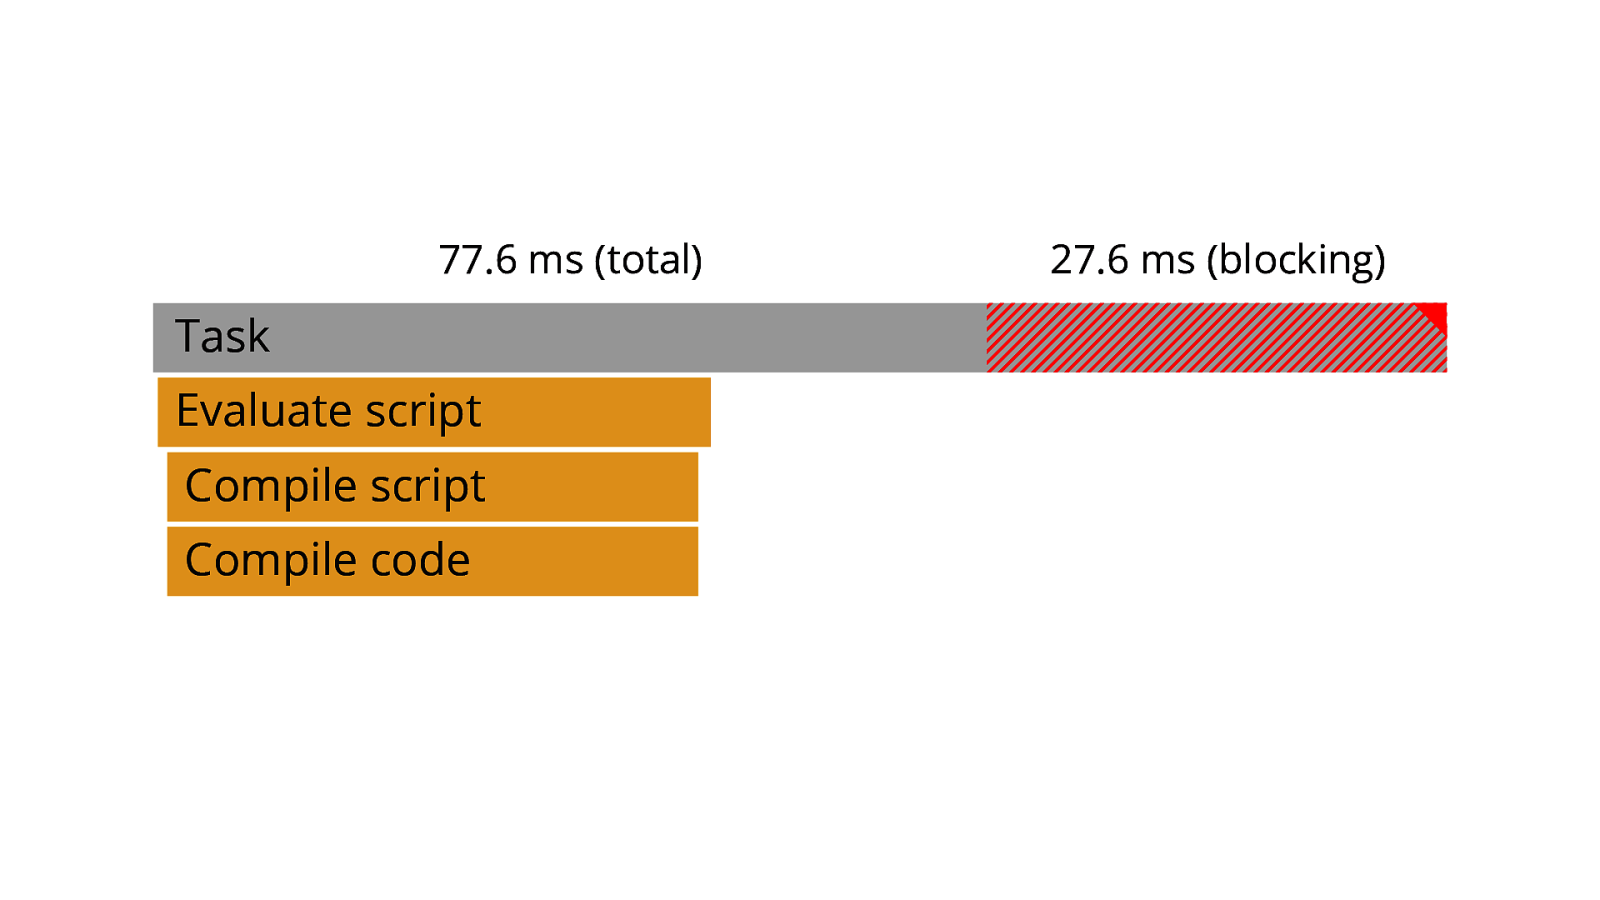
77.6 ms (total) 27.6 ms (blocking) Each task takes the amount time it requires to complete. [ADVANCE] However, if a task requires too much time, it a ects how quickly the main thread can respond to subsequent tasks. When that happens, that task becomes a long task. [ADVANCE 2x] fi ff A long task is any task exceeding 50 milliseconds. The portion of the task longer than 50 milliseconds is known as the the task’s blocking time, which is the amount of time the main thread is unable to respond quickly enough to new tasks. This is a signi cant source of poor input responsiveness. Long tasks can cause pages to be sluggish and unable to respond quickly to user inputs.
Slide 9
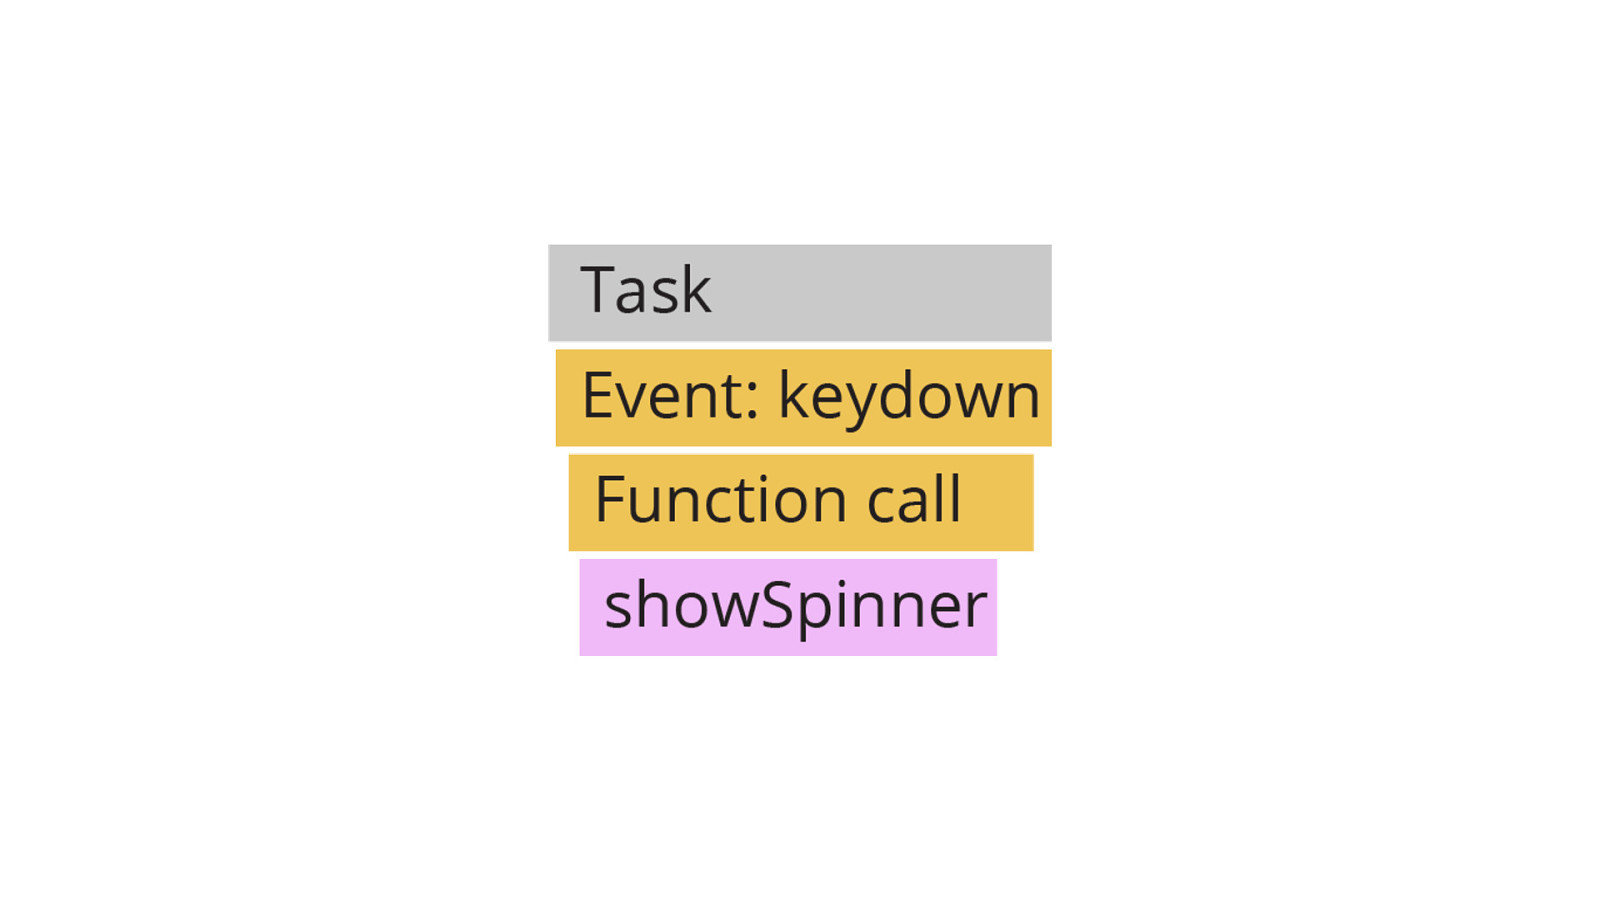
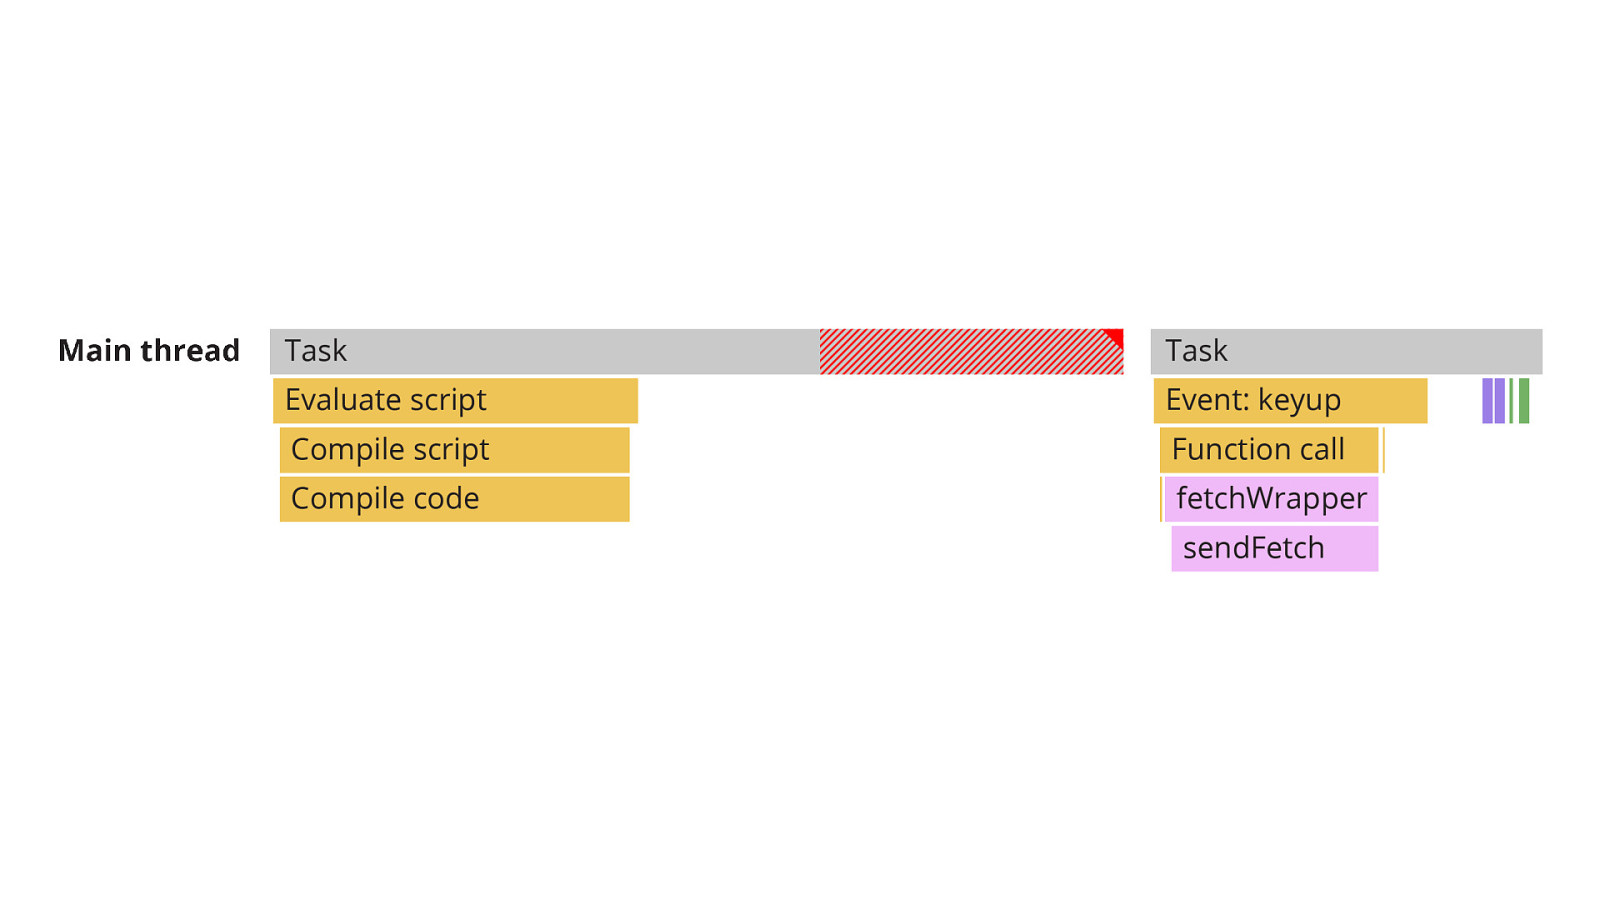
But it’s vital to remember that tasks drive everything that happens on the main thread—and that includes interactions. Here, you can see a single task that shows a loading spinner as a result of a keydown event. These types of interactions—and far more—make up the user experiences we use every day—and those interactions need to be fast. Because what we want is visual feedback sooner, and that visual feedback comes in the form of a new frame that the browser paints—hence the name of the metric—Interaction to Next Paint. One way of optimizing work in the browser is to avoid long tasks. Too many long tasks are a user experience problem. But more than that, it can also be the accumulation of many small tasks that can be problematic as well. In either case, the important thing to remember is that there is also time that the renderer requires in order to present the next frame. This involves some tasks that run on the main thread, such as style and layout calculations—but there’s also time involved on the GPU and compositor threads to get the next frame ready to paint.
fi
Long tasks are easier to identify in pro lers, so they’re a great place to start optimizing.
Slide 10
Why so much focus on tasks? Now you might be thinking: “Why are we spending so much time talking about tasks?” The reason is the event loop—which is something I won’t get into deep detail over, but it’s important to know just a bit about it, and how long tasks—or many small tasks — can sabotage the user experience.
Slide 11

The event loop is a continuously looping task queueing mechanism run by the main thread. It loops around…
Slide 12

…and around…
Slide 13

…and around…
Slide 14

…and around.
Slide 15

If this is the mental model you have in your head when it comes to the event loop and tasks, you’re pretty much spot on. Well, minus the mayhem and potential for serious injury, I suppose.
Slide 16
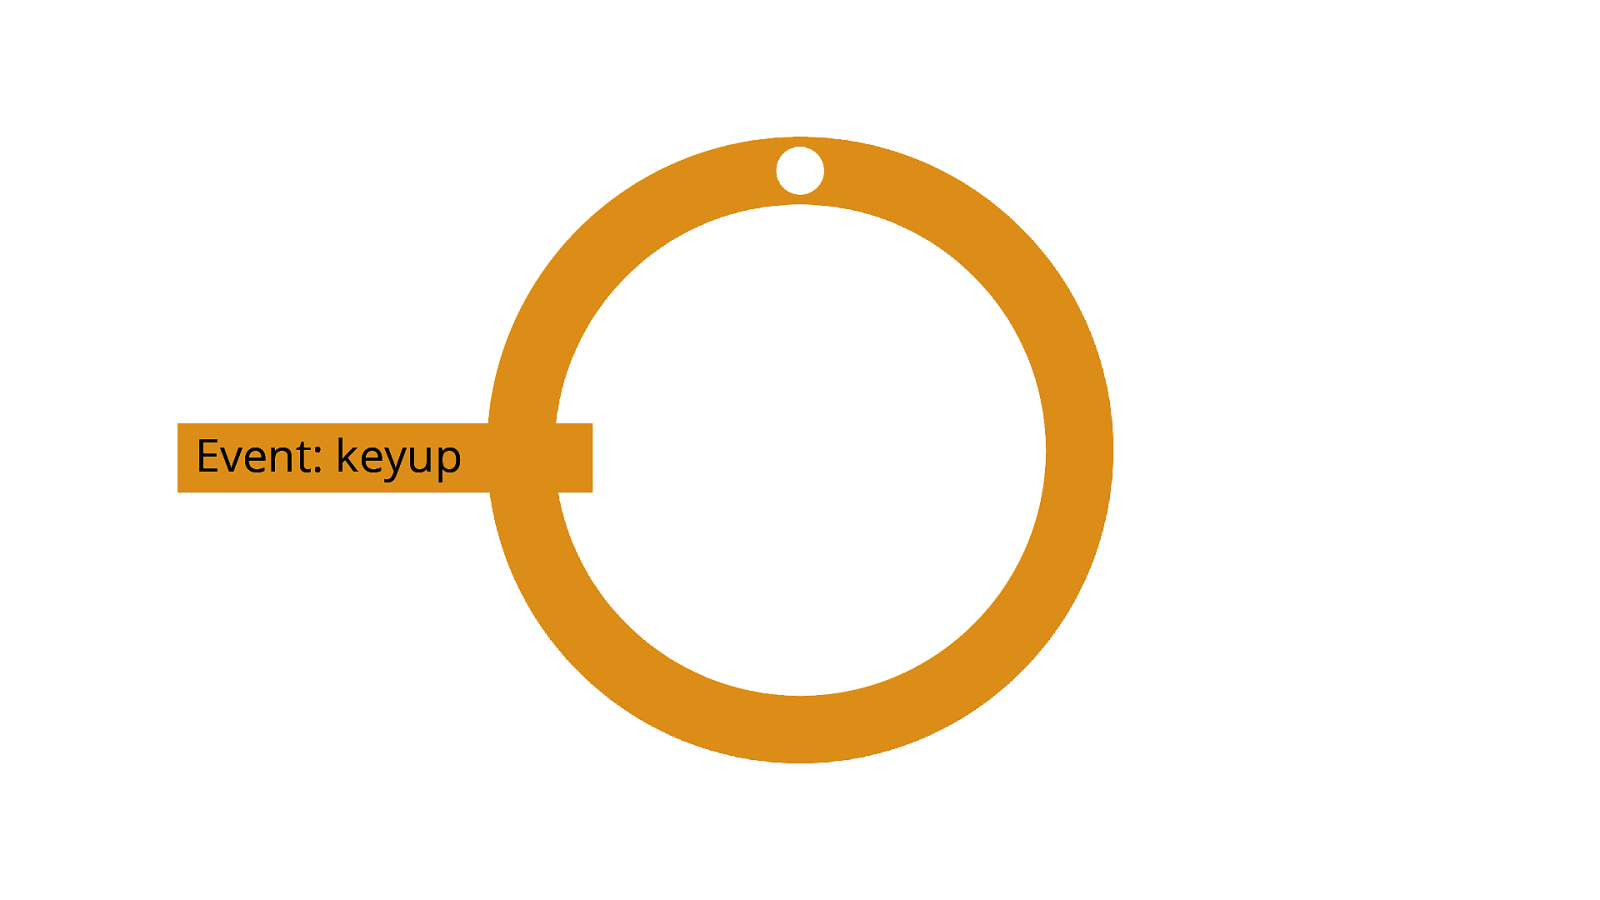
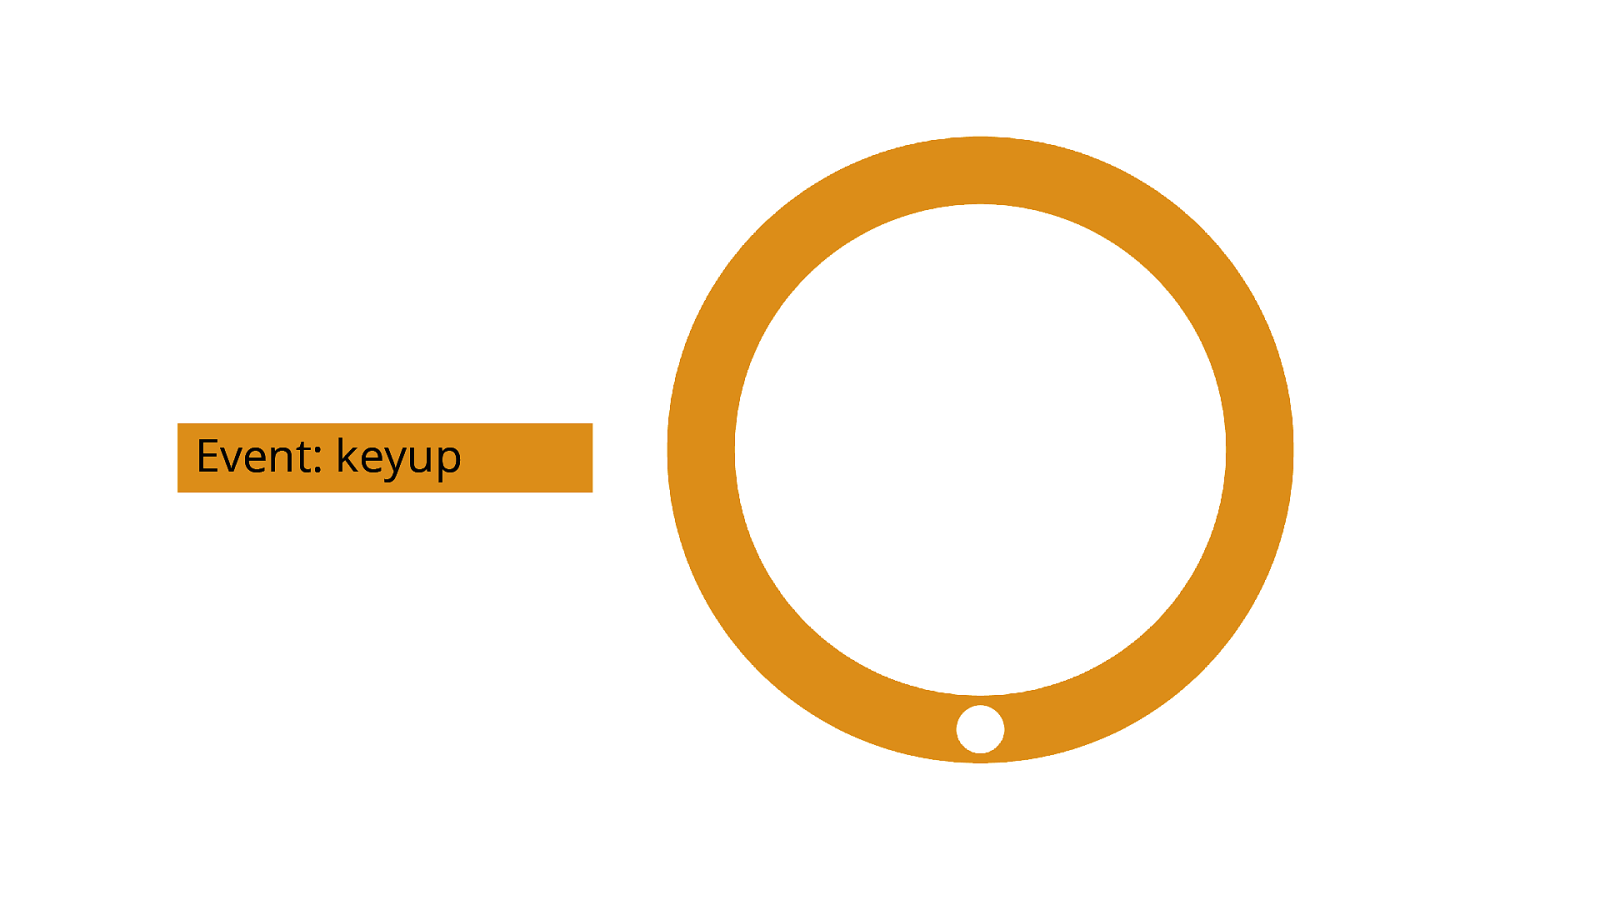
Anyway. The event loop keeps doing its thing until a task is queued up. [ADVANCE] When that happens, the event loop will pick up the task—a keyup event handler, for example.
Slide 17
[ADVANCE]
Slide 18
[ADVANCE]
Slide 19
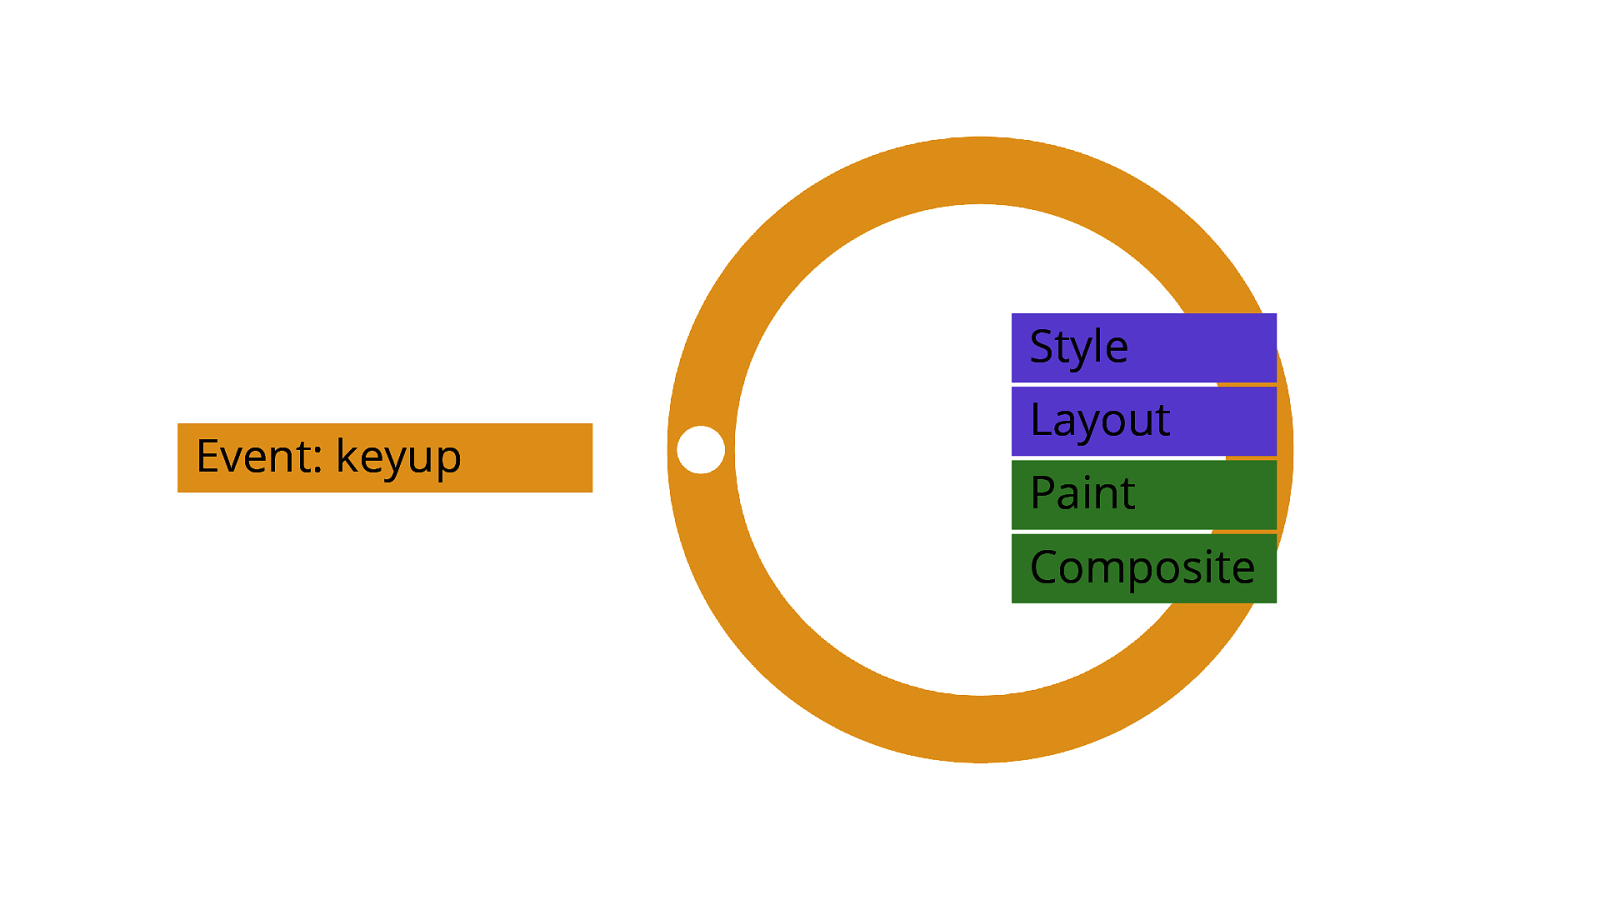
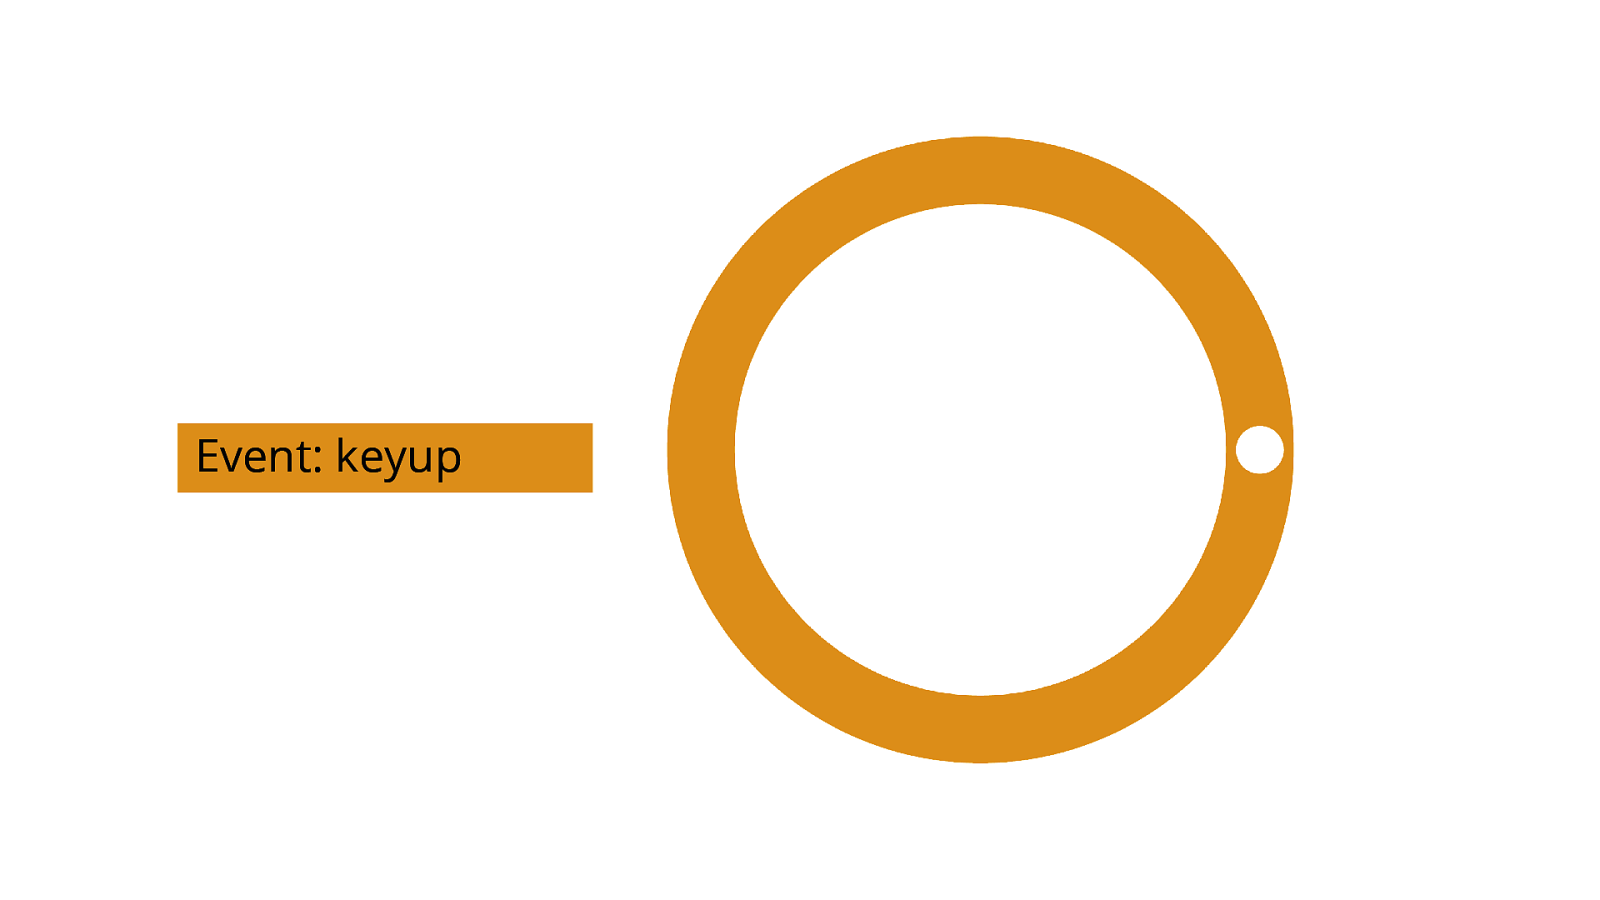
When the event loop has picked up the task, it processes it, and pops it o of the queue when nished. [ADVANCE x2] Then, if the task caused any changes to the layout, the browser has to do rendering work to re ect those changes before the next paint. fl fi ff [ADVANCE]
Slide 20
[ADVANCE]
Slide 21
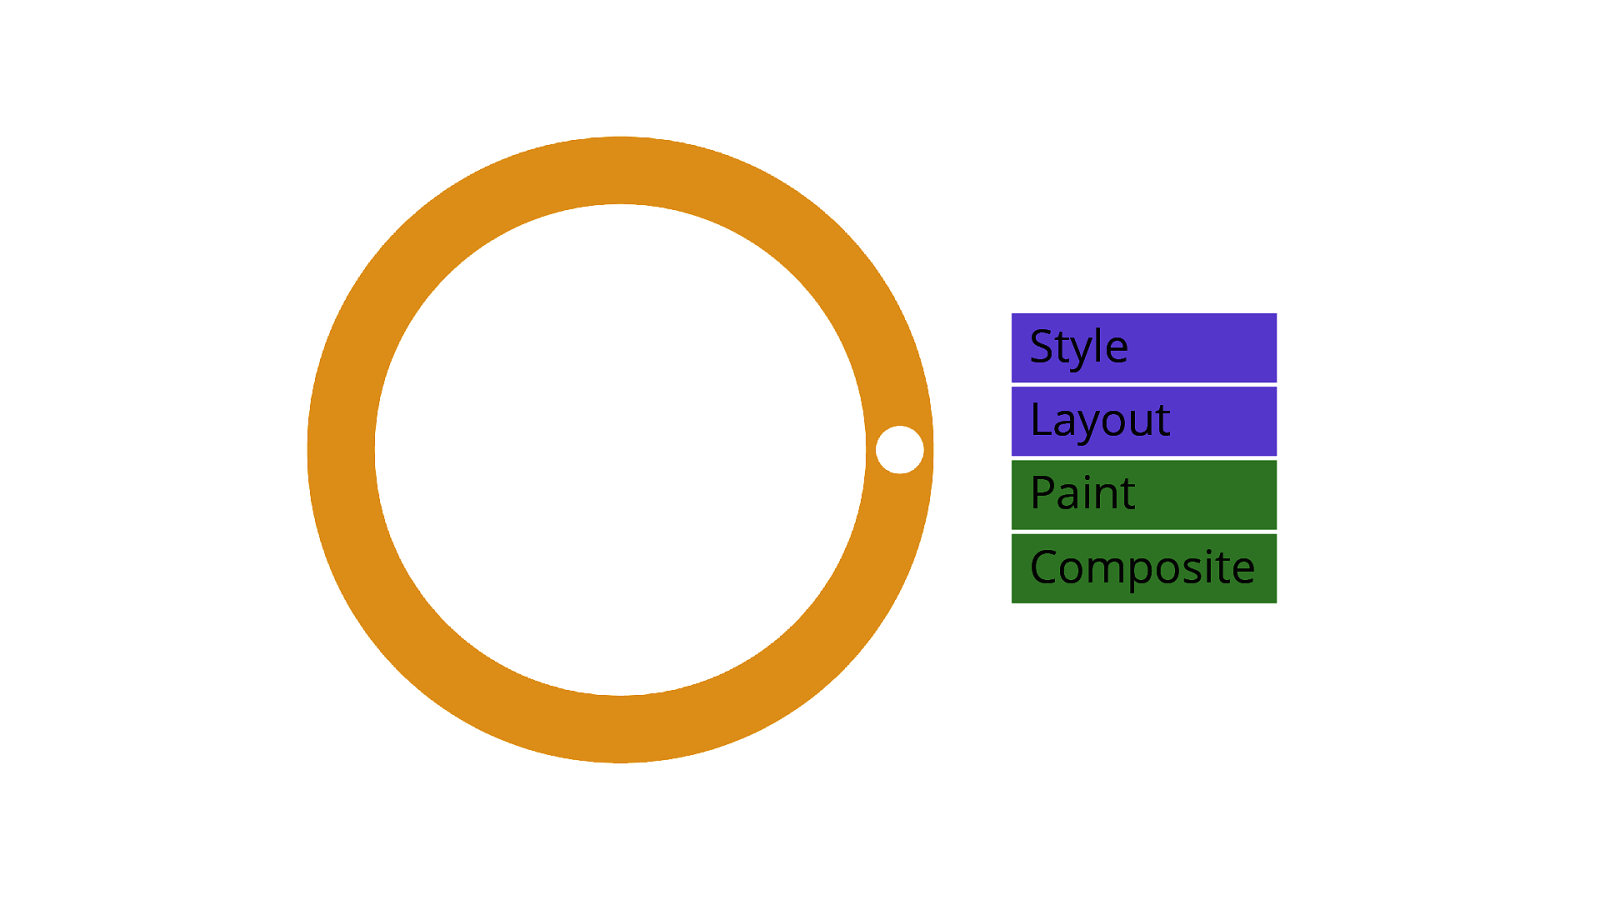
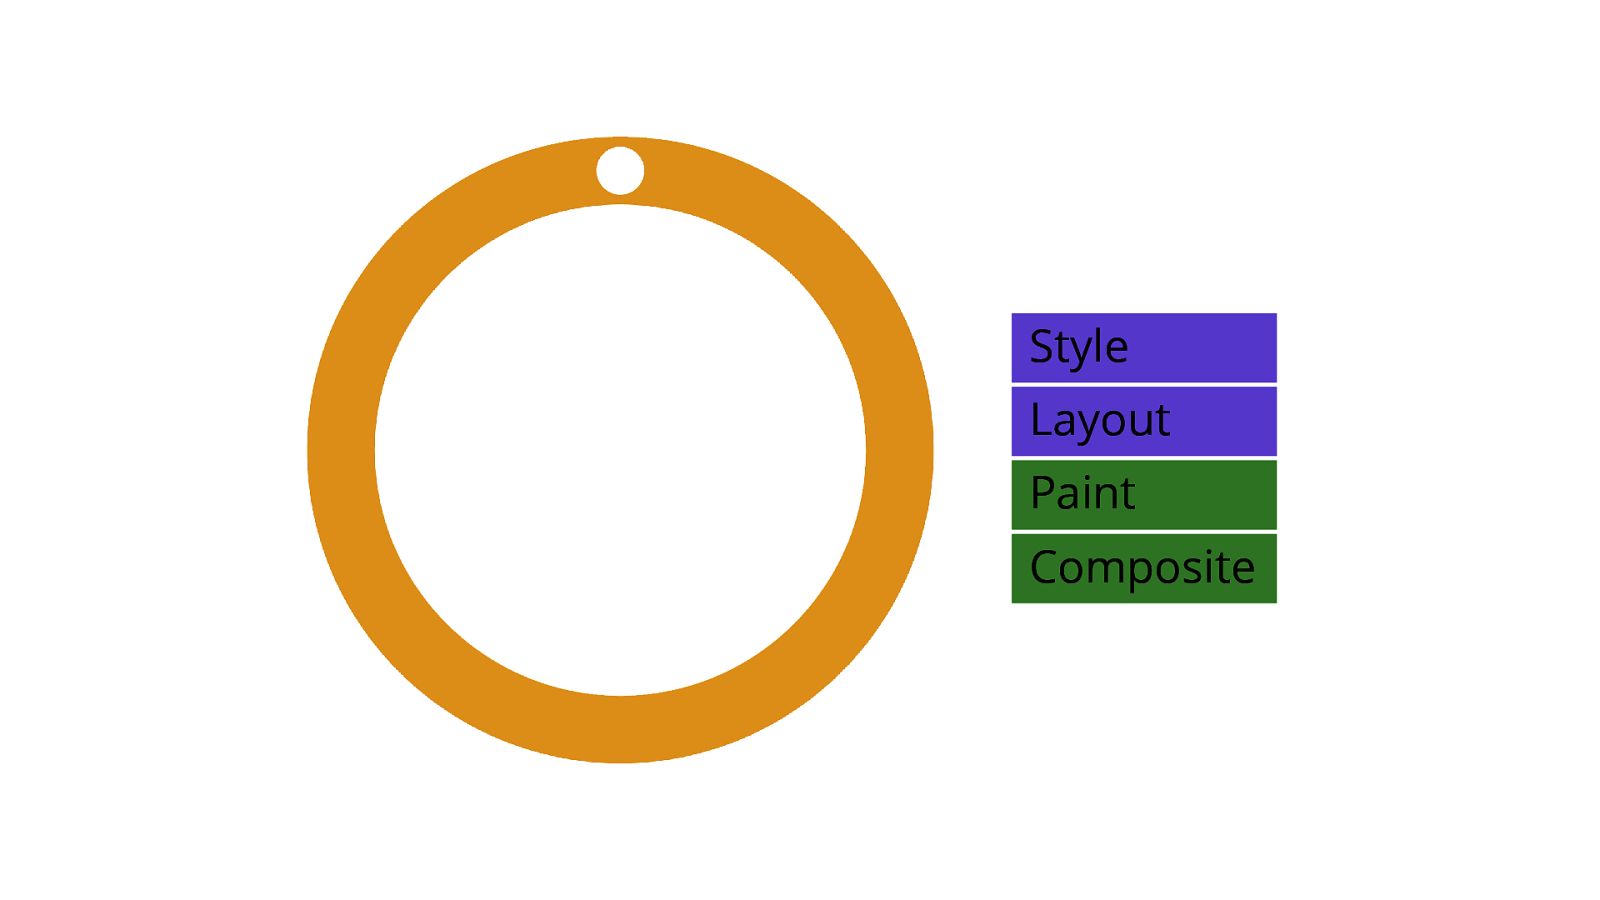
When that rendering work is completed… [ADVANCE] The browser presents a new frame, which is the visual feedback from the task. [ADVANCE] If tasks don’t become long tasks—or if there aren’t a lot of small tasks that pile up in the queue—everything goes smoothly.
Slide 22
But when there’s too much work, visual feedback is delayed—that stuttering, janky feeling you get when things aren’t going smoothly—and even outright freezing of the browser tab in extreme cases. fi INP is a metric that quanti es a page’s ability to avoid doing these things.
Slide 23
web.dev/inp ffi This will be quick rundown of how INP works, but for the full story, you’re going to want to read the o cial documentation at web.dev/inp to get a sense of all the little nooks and crannies in terms of how it works—because it is a complex metric! But I’ll do my best to summarize.
Slide 24
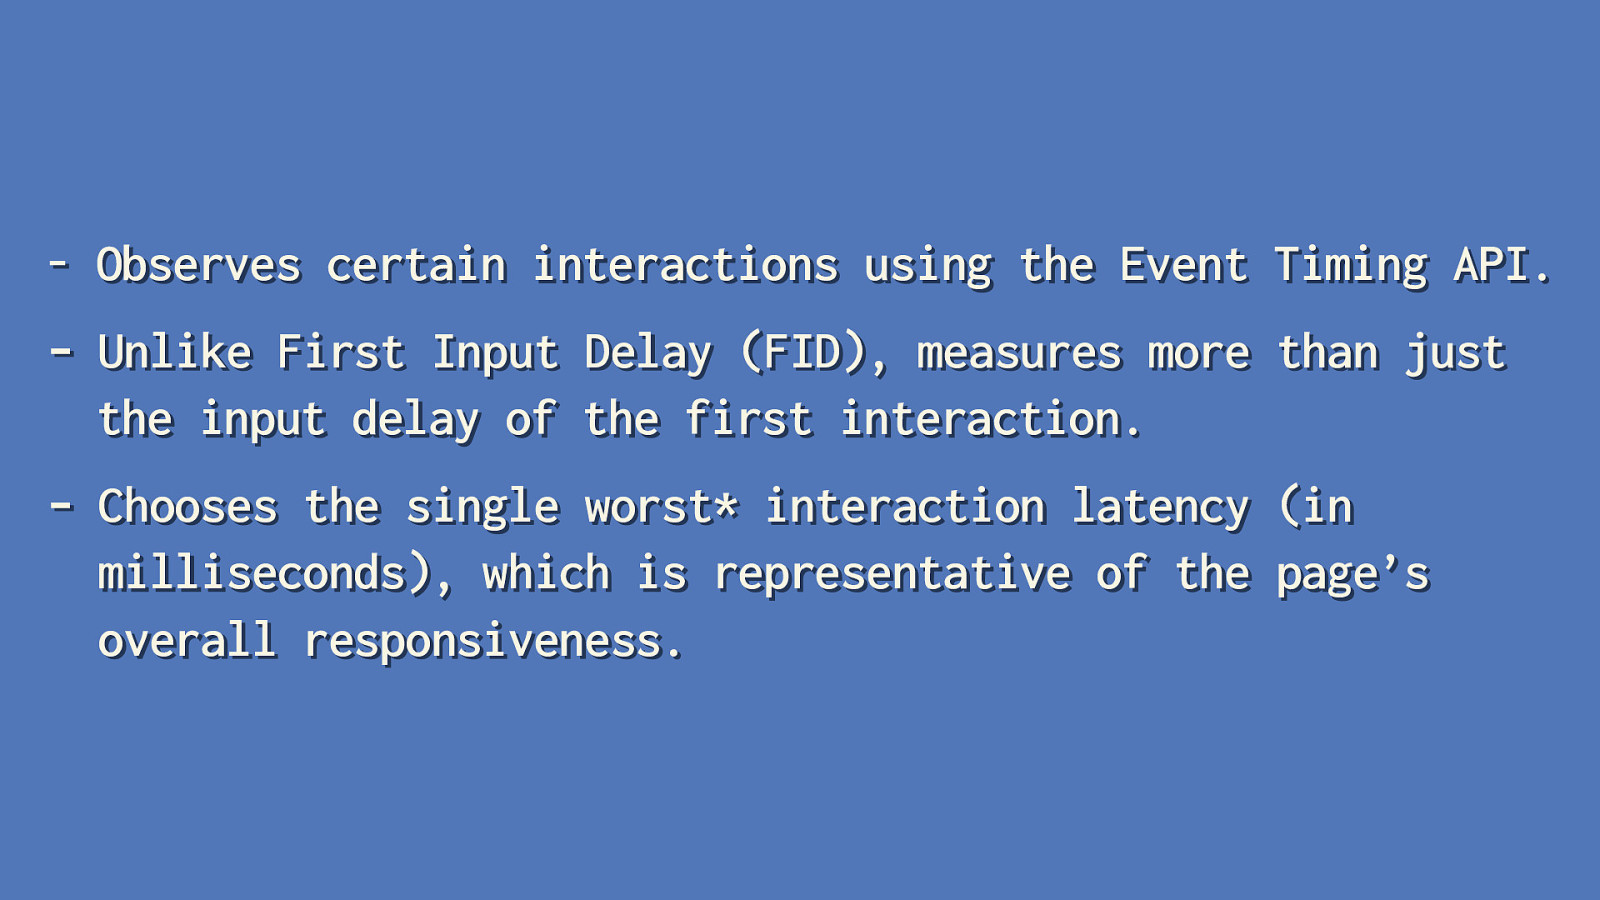
- Observes certain interactions using the Event Timing API.
- Unlike First Input Delay (FID), measures more than just the input delay of the first interaction.
- Chooses the single worst* interaction latency (in milliseconds), which is representative of the page’s overall responsiveness. INP is a metric that
- [ADVANCE] Observes certain interactions using the Event Timing API. This API receives an entry every time the user interacts with the page, and contains timings for fi
fi
those interactions. [ADVANCE] Unlike First Input Delay, INP measures more than just the input delay of the rst interaction—if you don’t know what “input delay” is, don’t worry. We’ll get there. [ADVANCE] And nally, it chooses the single worst interaction—or close to it—which is intended to represent the page’s overall interaction latency—it’s a bit more complicated than this, so more on this in a bit.
Slide 25
INP is all about the next frame. fi The takeaway from all this is that INP is all about the time it takes for a new frame to be presented for the current interaction. From the time the operating system recognizes an input, for the browser to pick up that input, for the event handlers that drive it to run, and nally, for the time it takes the browser to do all the rendering work to show you the results of that work.
Slide 26
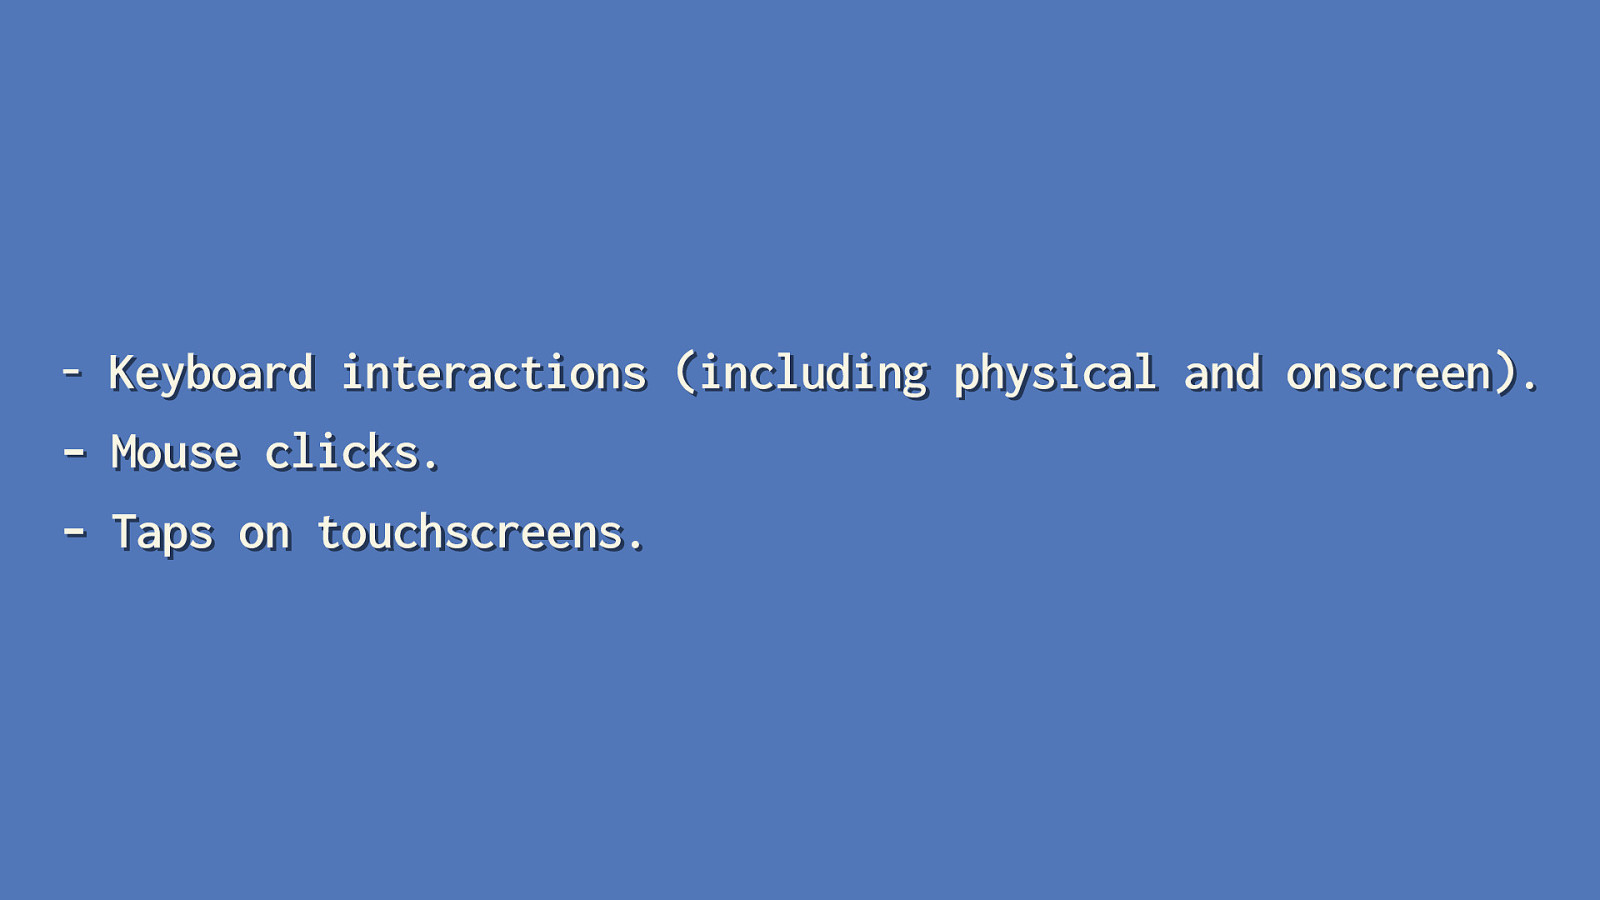
- Keyboard interactions (including physical and onscreen). - Mouse clicks. - Taps on touchscreens. However, INP doesn’t measure all interaction types—but it does measure those that drive most user interactions. Those include:
- [ADVANCE] Keyboard interactions. - [ADVANCE] Mouse clicks. - [ADVANCE] Taps on touchscreens.
Slide 27

- Hovering. - Network activity. - Scrolling*.
It’s also important to call out what doesn’t get taken into account for INP—at least directly. This isn’t an exhaustive list, but just a few things that are important to call out. [ADVANCE] Hovering over elements with a ne pointer device—such as a mouse—don’t count towards INP. However, that could trigger animation work that may a ect a soon-to-be future interaction. For example, say you have a button that has a hover animation. If that work is occurring as the user clicks on the button. That may delay the presentation of the next frame. [ADVANCE] Network activity isn’t factored into the duration of an event for INP—however,
fetchrequests are asynchronous and can have an indirect e ect. [ADVANCE] ff ff fi ff Scrolling isn’t taken into account either. However, users can scroll with the spacebar, so if an event captures spacebar inputs, that could theoretically queue up tasks that may a ect that interaction, but the scrolling itself isn’t considered.
Slide 28
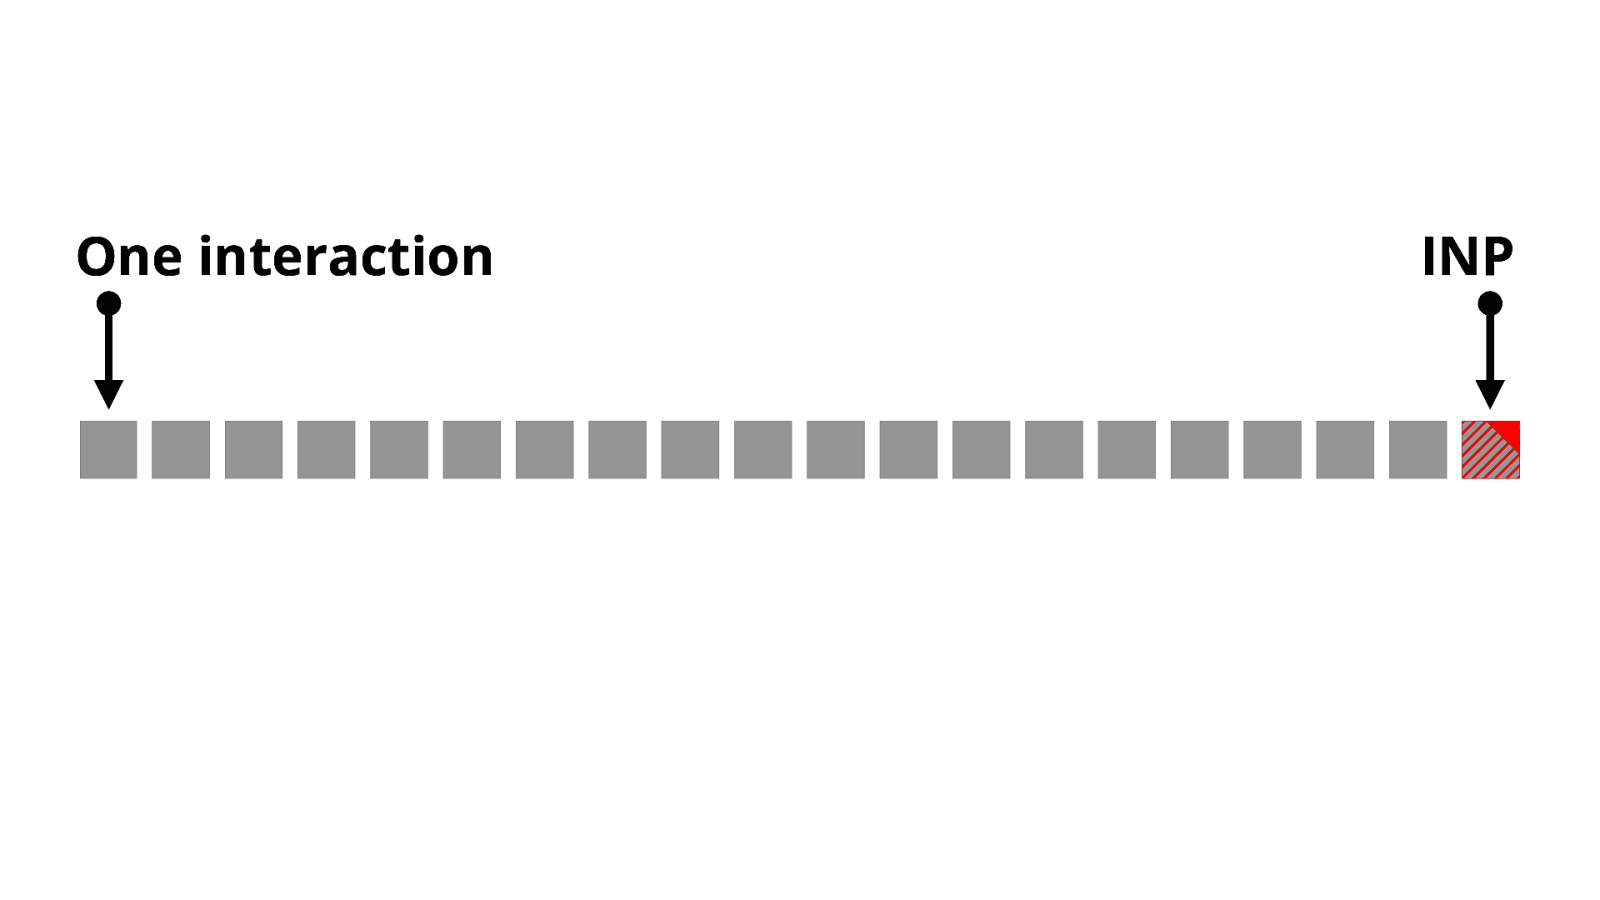
One interaction INP All qualifying interactions are recorded throughout the lifecycle of the page. When the page is unloaded for a new one, the page’s INP is calculated by choosing one of those interactions. [ADVANCE] For pages with relatively few interactions—such as pages with mostly text and images, or just simpler applications with fewer input requirements—this is often the interaction with the most latency.
Slide 29
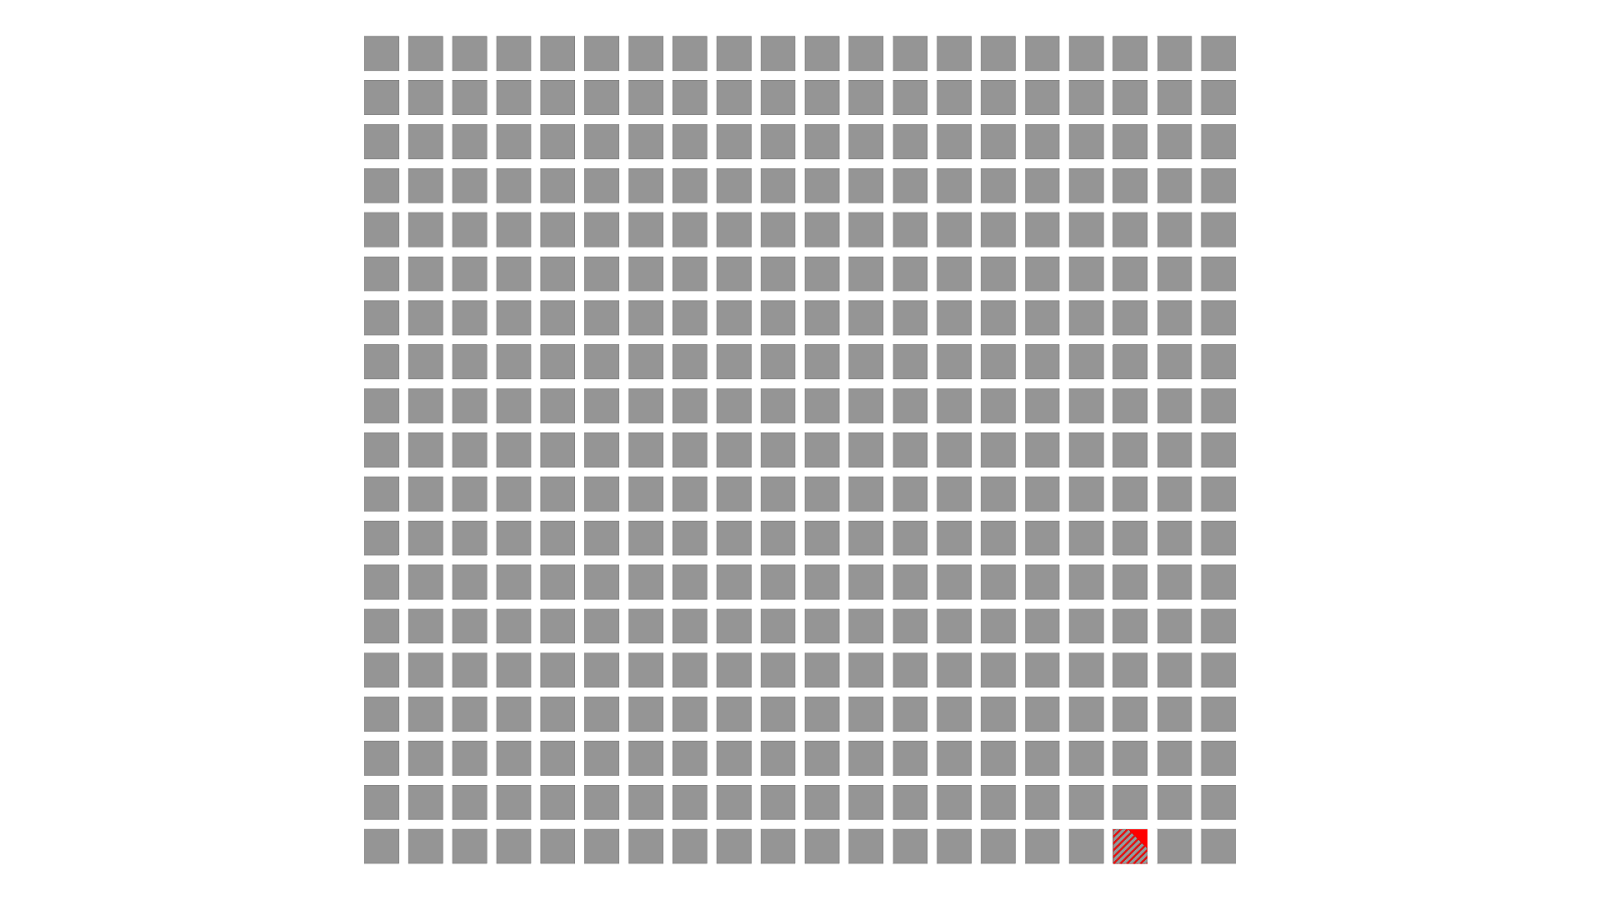
However, some pages have many interactions before they’re unloaded, such as single page applications and rich apps like in-browser games, text editors, and other application types. [ADVANCE] In such cases, we don’t want to penalize developers by selecting what could be an extreme outlier of interaction latency. In cases like these, the 98th percentile of interaction latency is selected.
Slide 30
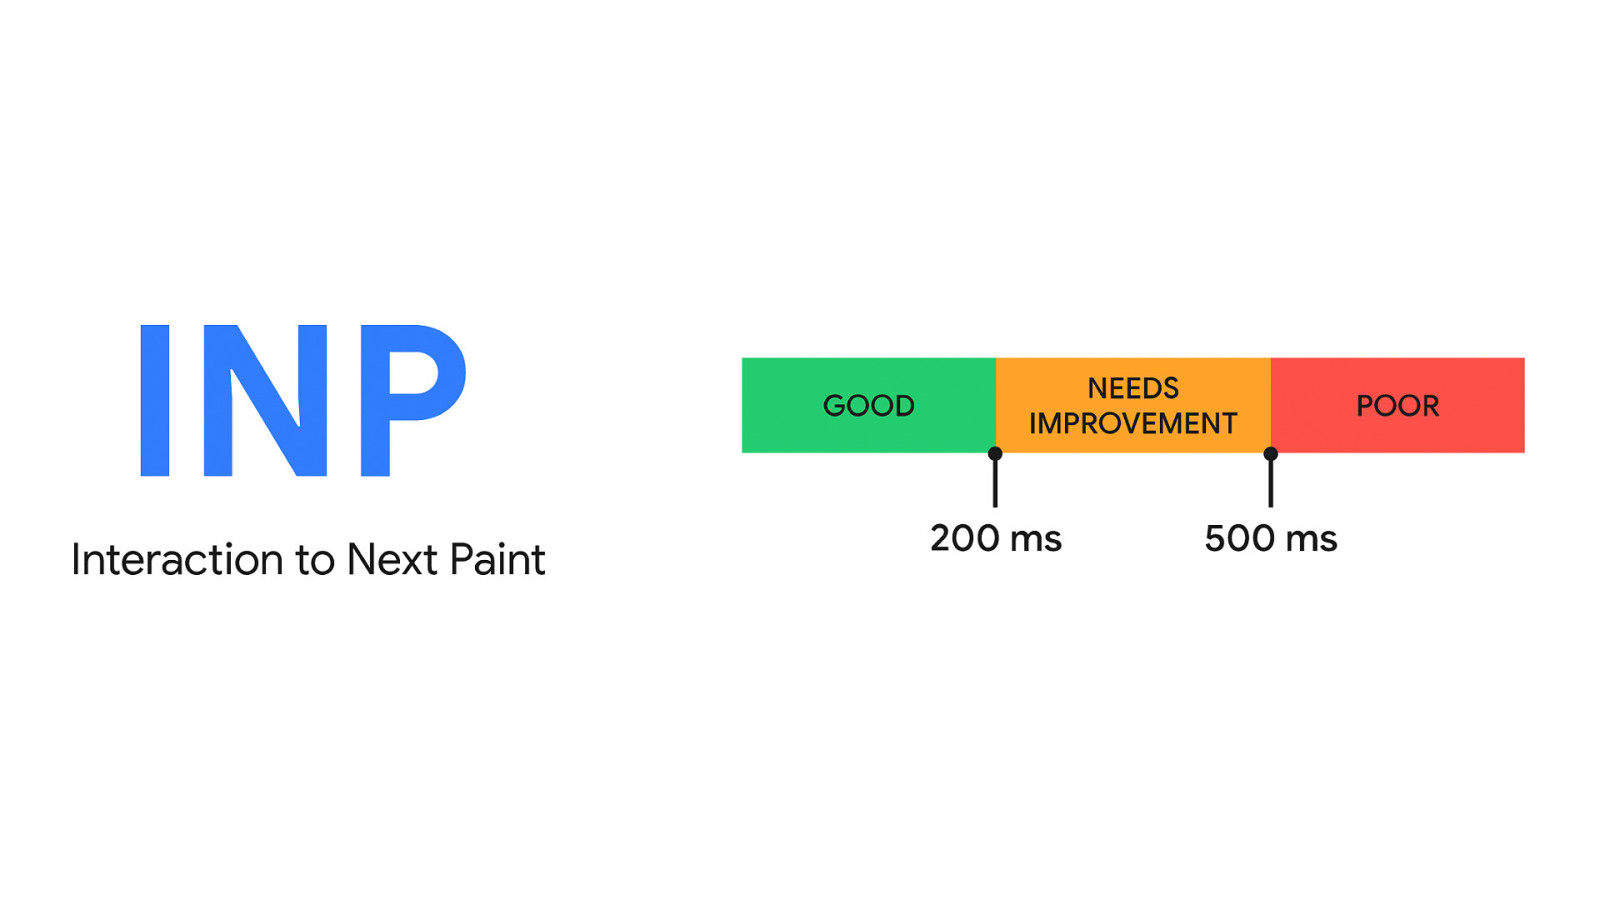
The resulting value is the page’s INP. The idea is that by selecting the worst interaction on the page—or closest to the worst—you have a value that represents a page’s overall interaction latency. Think of it this way: if your INP is in the good range—that is, 200 milliseconds or less—all interactions on your page are reliably fast. If your INP needs improvement or is poor, then it’s likely that most of your page’s interactions are too slow.
Slide 31
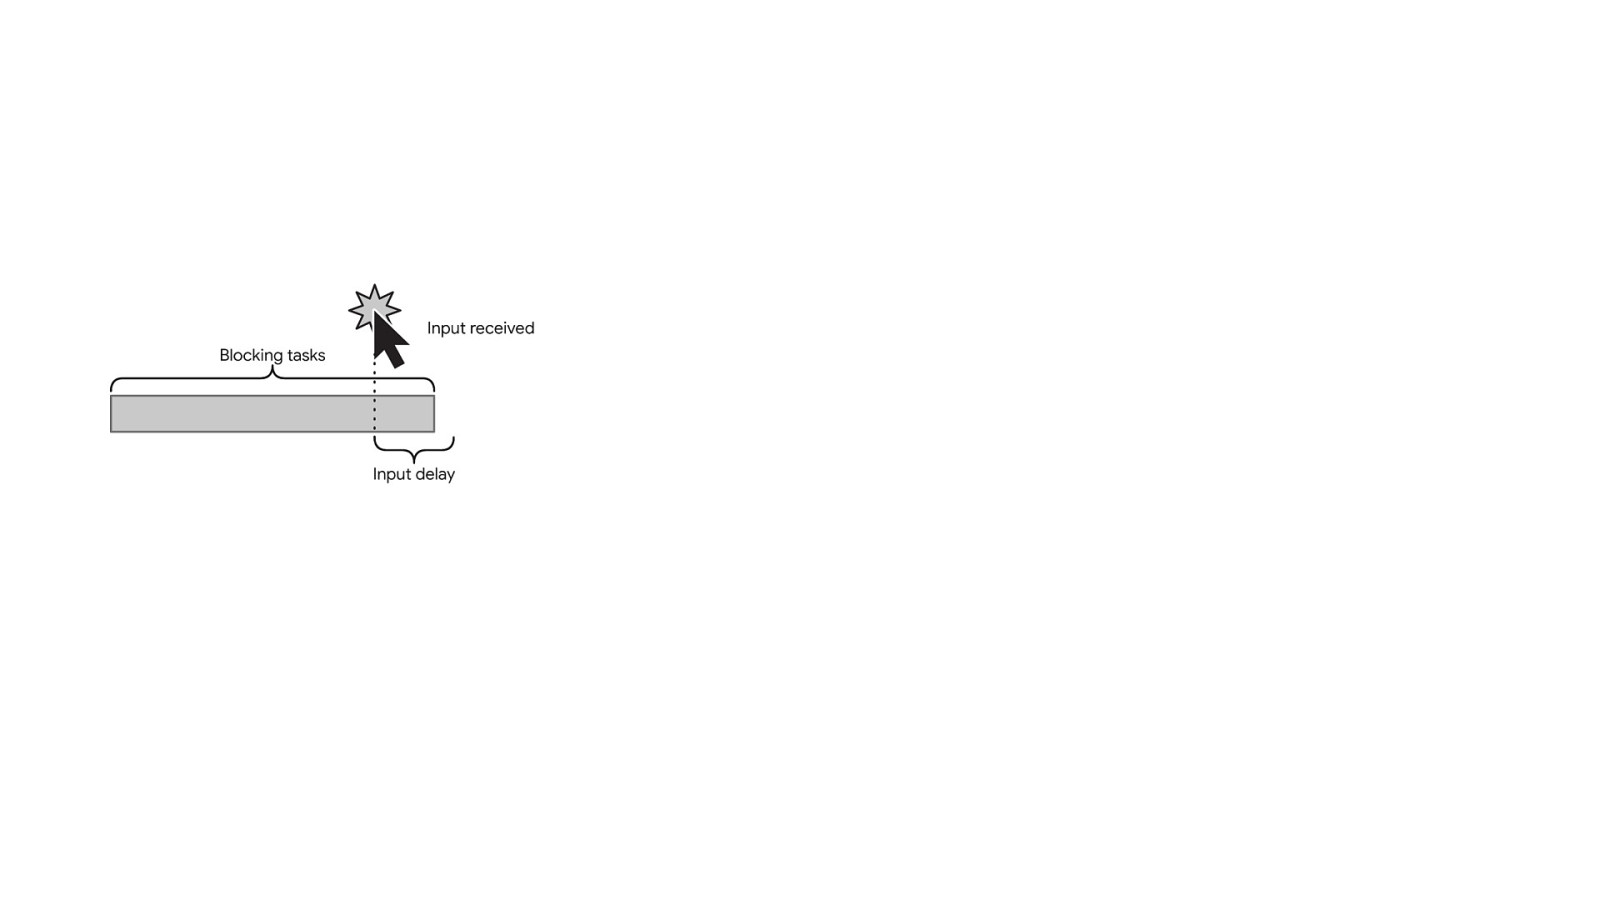
But what does an interaction look like? [ADVANCE] fi fi The rst part of the interaction starts with user input from one of the interaction types we just discussed. For example, say a user clicks on a button to open a menu. When the user clicks, there is a period of time between when the user clicks and event handlers begin to run called the input delay. This is what First Input Delay measures, but only for the rst interaction. INP measures more than this—it measures the entire interaction—which you’ll see shortly.
Slide 32
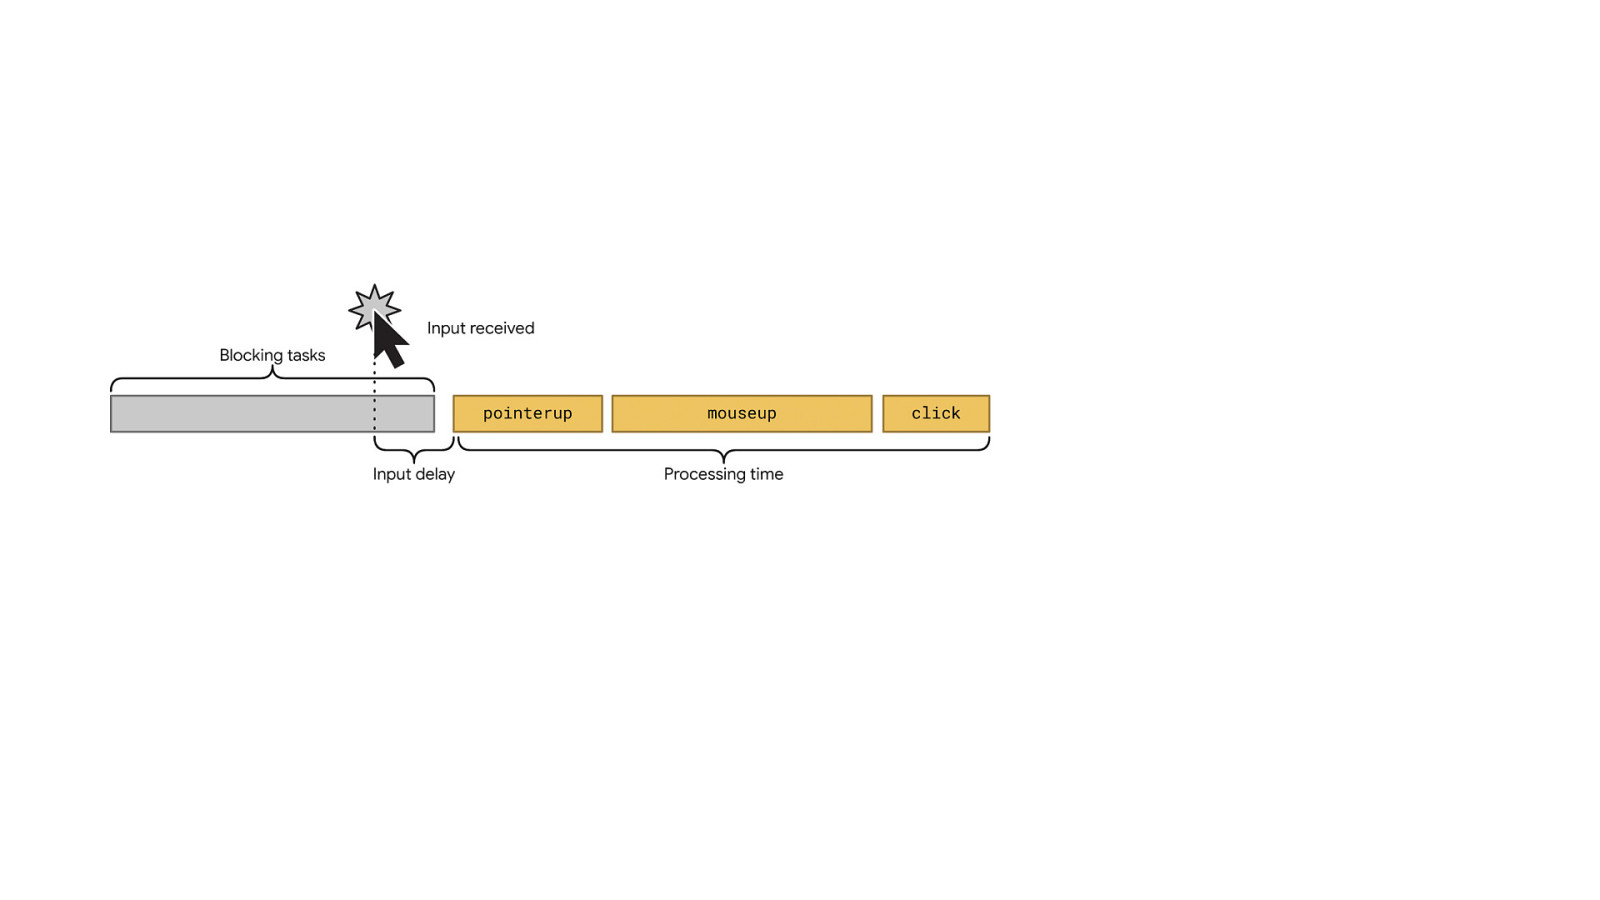
You’ll always incur some input delay, because at the very least, it takes time for the browser to receive the input event from the operating system. But that delay can be increased due to tasks on the main thread as the input occurs—long tasks in particular. If you have a lot of long tasks on the main thread, input delays can increase. Once the input delay is over, the event handlers responsible for driving the interaction can run—here we see a set of event handlers for a mouse click. The goal here is to ensure those event handlers run as fast as possible.
Slide 33
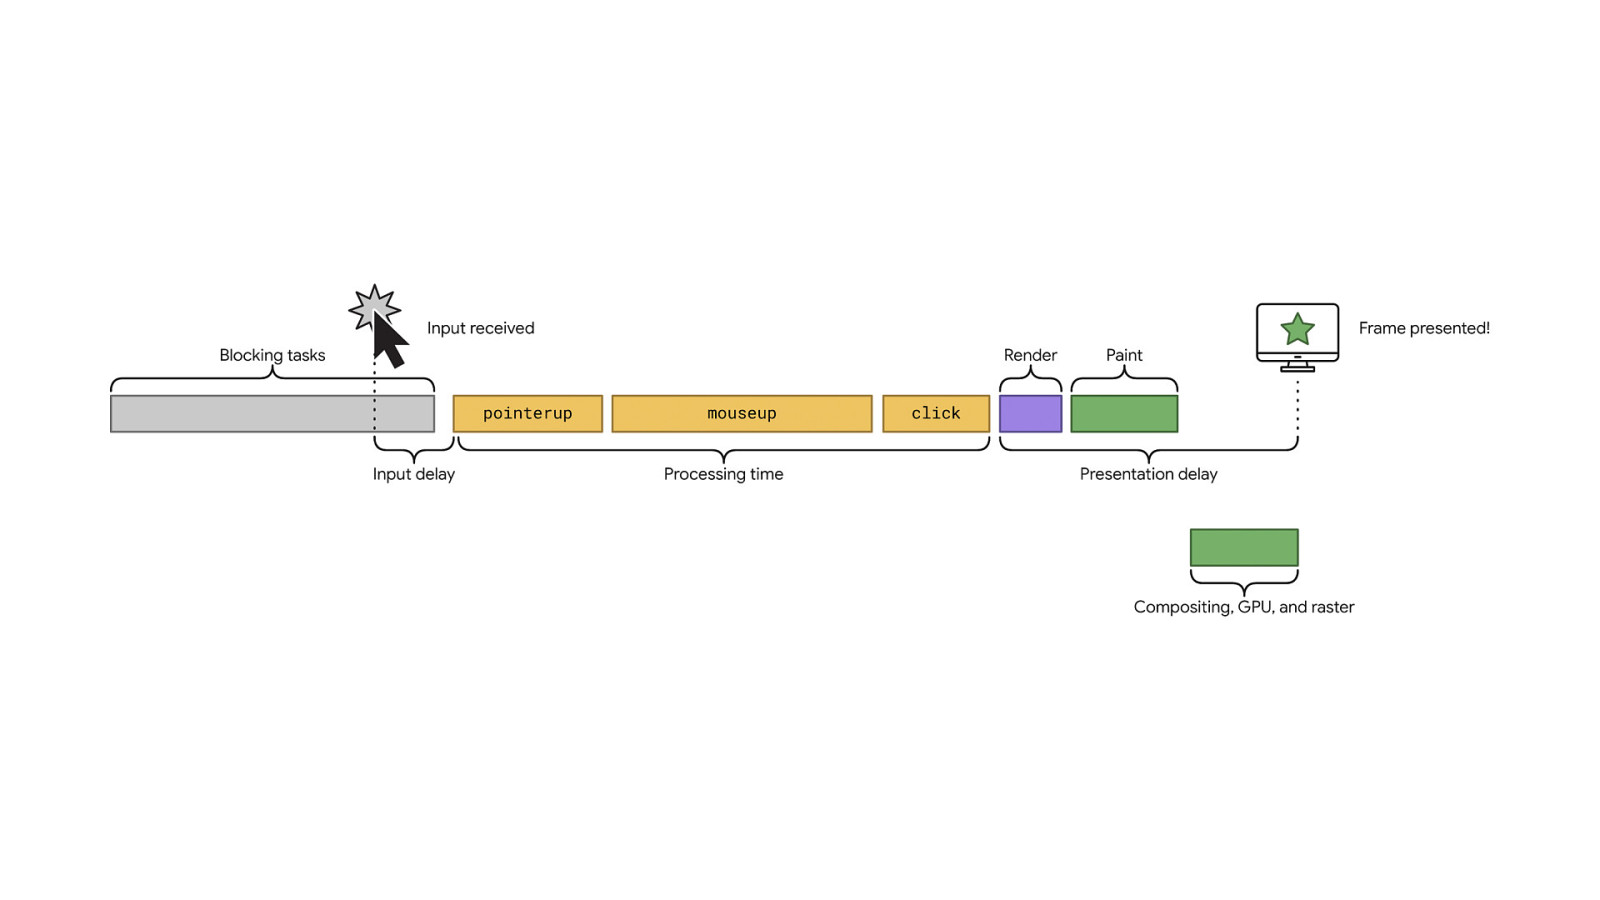
You don’t want those event handlers to run for too long, because the browser has to do work in order to present the visual feedback the user needs in order to see that something has happened. Once the event handlers nish running, the browser then needs to do rendering, painting, and compositing work in order to present the next frame. This is called the presentation delay, and all this work to present a new frame to the user needs to occur as quickly as possible as well. fi The presentation delay represents just the main thread portion of the rendering work. There are a lot of nooks and crannies in how long this takes.
Slide 34
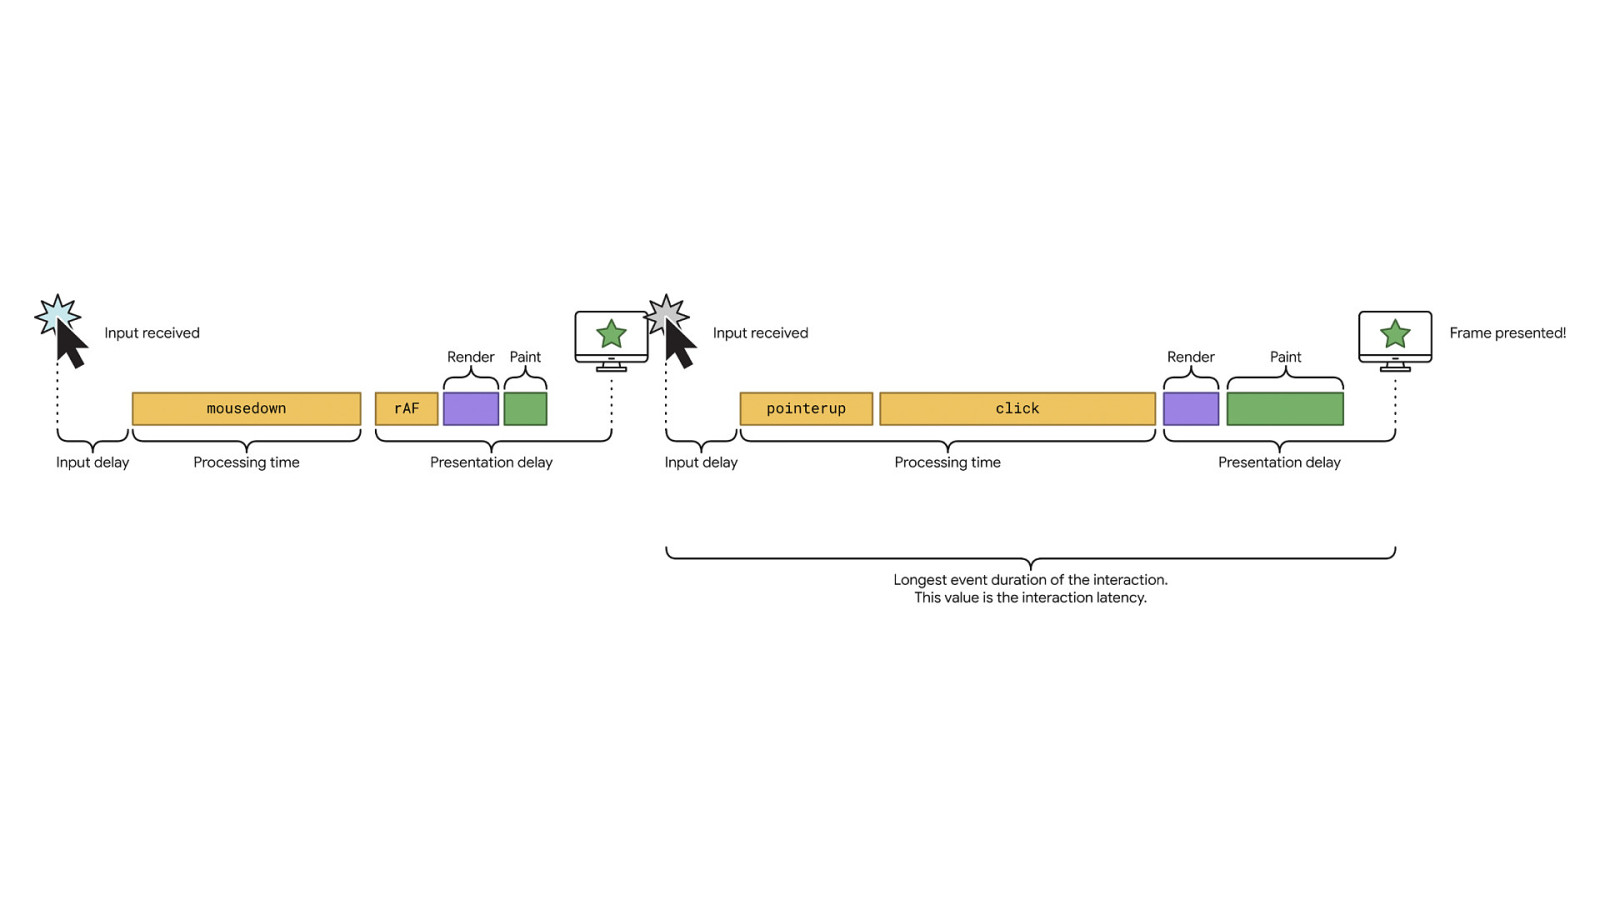
And it gets more complicated—A single interaction can contain multiple input delays, event handlers, and presentation delays. Here, you can see a mouse interaction where a frame is presented after the user pushes down on a mouse button, but then when the button is released, a new batch of event handlers and rendering tasks must run to present additional visual feedback. In cases where there are multiple events in an interaction, the longest event duration of the interaction will be chosen as the latency for the interaction.
Slide 35
Optimizing INP fi fi Now we’re ready to talk about how to optimize for INP. When you optimize INP, you’re going to want to rst measure it—and not just in lab tools, but using eld data.
Slide 36
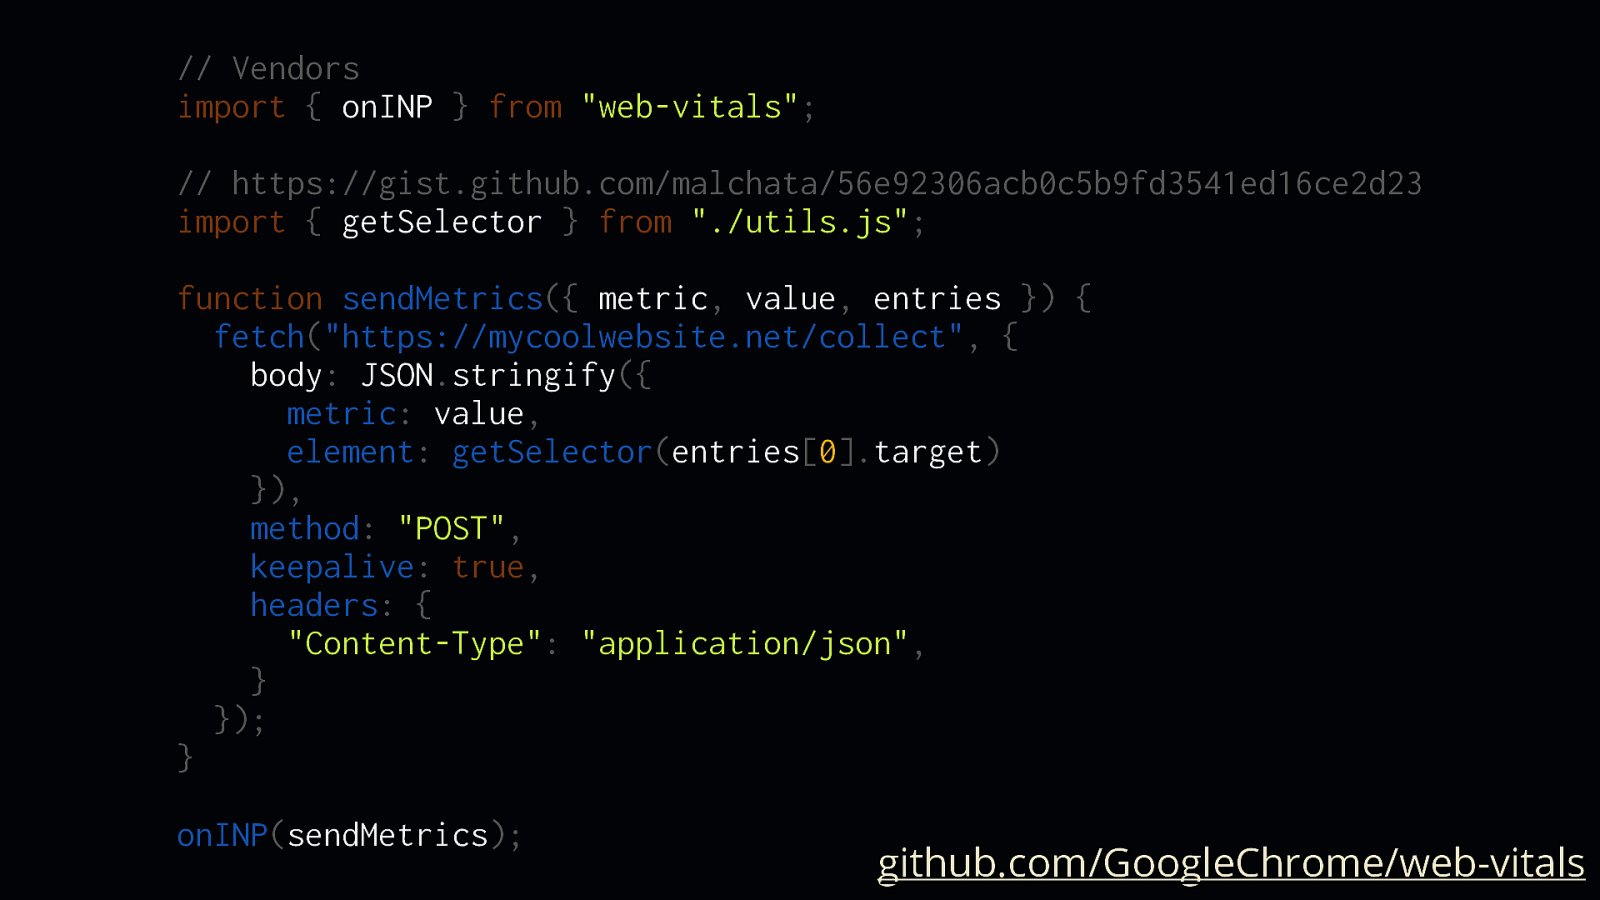
// Vendors import { onINP } from “web-vitals”; // https://gist.github.com/malchata/56e92306acb0c5b9fd3541ed16ce2d23 import { getSelector } from “./utils.js”; function sendMetrics({ metric, value, entries }) { fetch(“https://mycoolwebsite.net/collect”, { body: JSON.stringify({ metric: value, element: getSelector(entries[0].target) }), method: “POST”, keepalive: true, headers: { “Content-Type”: “application/json”, } }); } onINP(sendMetrics);
github.com/GoogleChrome/web-vitals
Field data is important because it lets you know how your website is being experienced by actual users, and one way to gather that eld data yourself is to use the webvitals library.
fi
The library exposes methods for each of the core web vitals, but also INP. Each method takes a function that exposes properties for the observed metric, most importantly the metric name—INP in this case—its value, as well as the element responsible for it (provided as a selector string by a function in the linked gist).
Slide 37
Lab tools fi When you’ve got that eld data and you know which elements are responsible for high interaction latency, it’s time to go to the lab and start testing those interactions— because it’s lab tools that will give you a bit more insight into why interactions are slow.
Slide 38
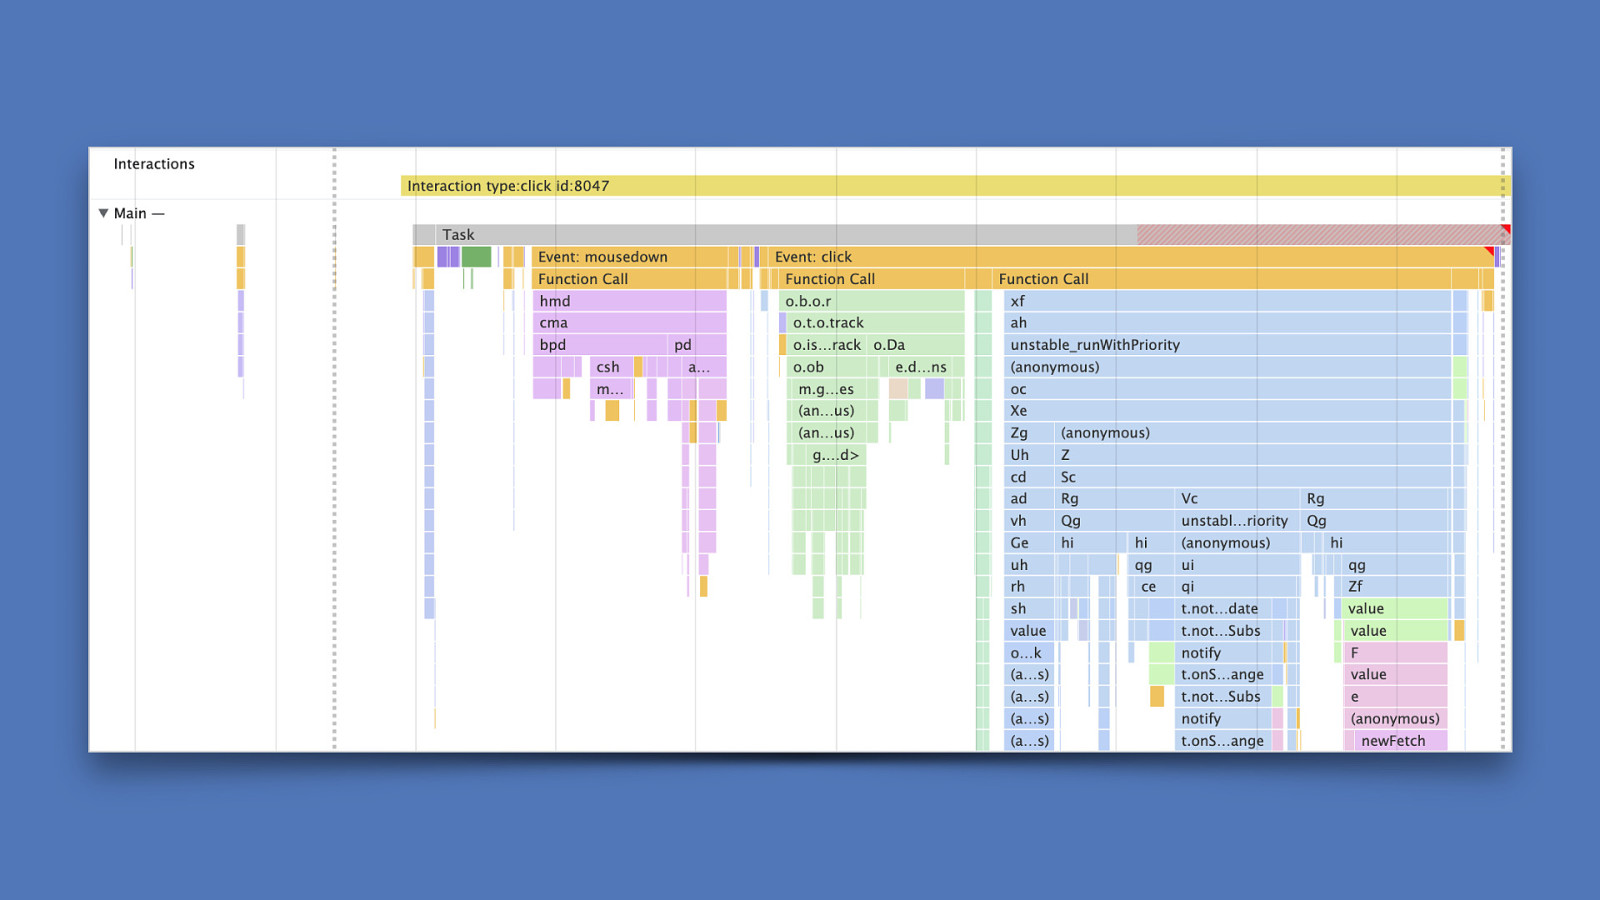
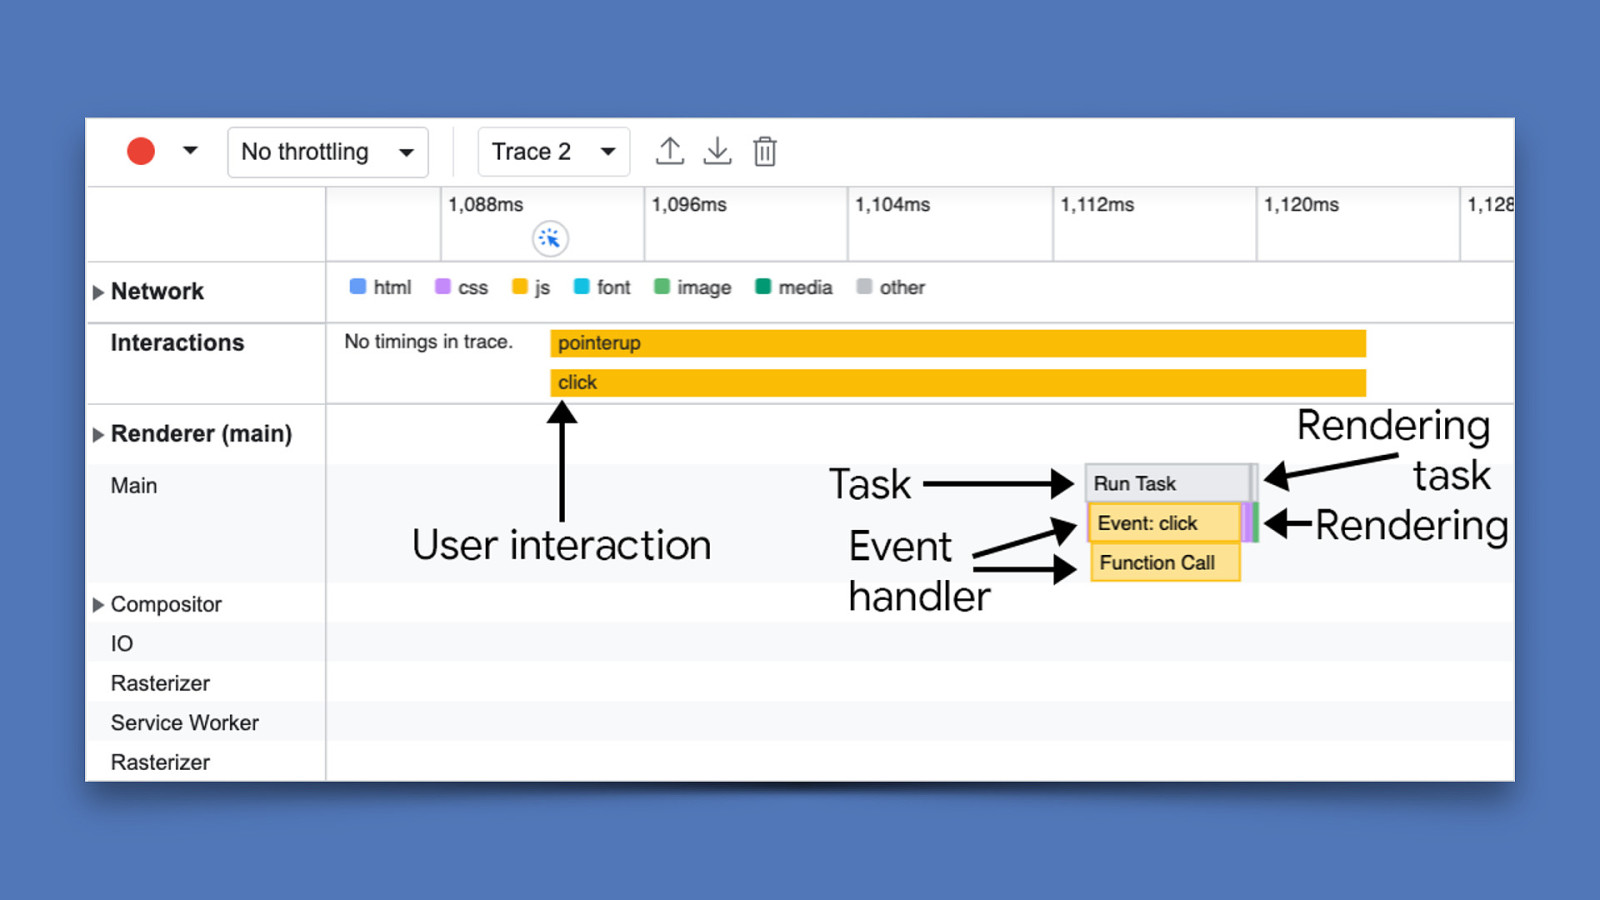
One useful lab tool is in Chrome DevTools starting Chrome 106. We can now rely on the performance pro ler to show interaction details right in a performance trace. So say you know what element is causing trouble—you can test that in the performance panel and dive right into that interaction. [ADVANCE] For example, you can see in the interactions area near the top of the trace, there’s an item labeled “Interaction type: click”. This means that this interaction counts towards INP, and we can see we have a long task on our hands that has two events for mousedown and click—with the click event handler taking the longest amount of time.
fi
This method lets you dive right into what’s causing the delay during processing and give you some ideas for how to break up or optimize that work—because this particular long task causes quite a bit of a delay in the next frame being presented.
Slide 39
fi fi But if you want something a bit more focused, you can also see interactions in the new performance pro ler in the “performance insights” panel in Chrome DevTools. It’s a streamlined version of the performance pro ler we’re all familiar with, but a bit easier to use.
Slide 40
Optimize! So you’ve pro led an interaction, and now you want to know what you can do to optimize it. What do you do next? fi fi The answer to this is rather complicated, and it depends on your website. Every slow interaction has its own x, but I’m hoping the following provides you with a general strategy for getting your tasks under control.
Slide 41
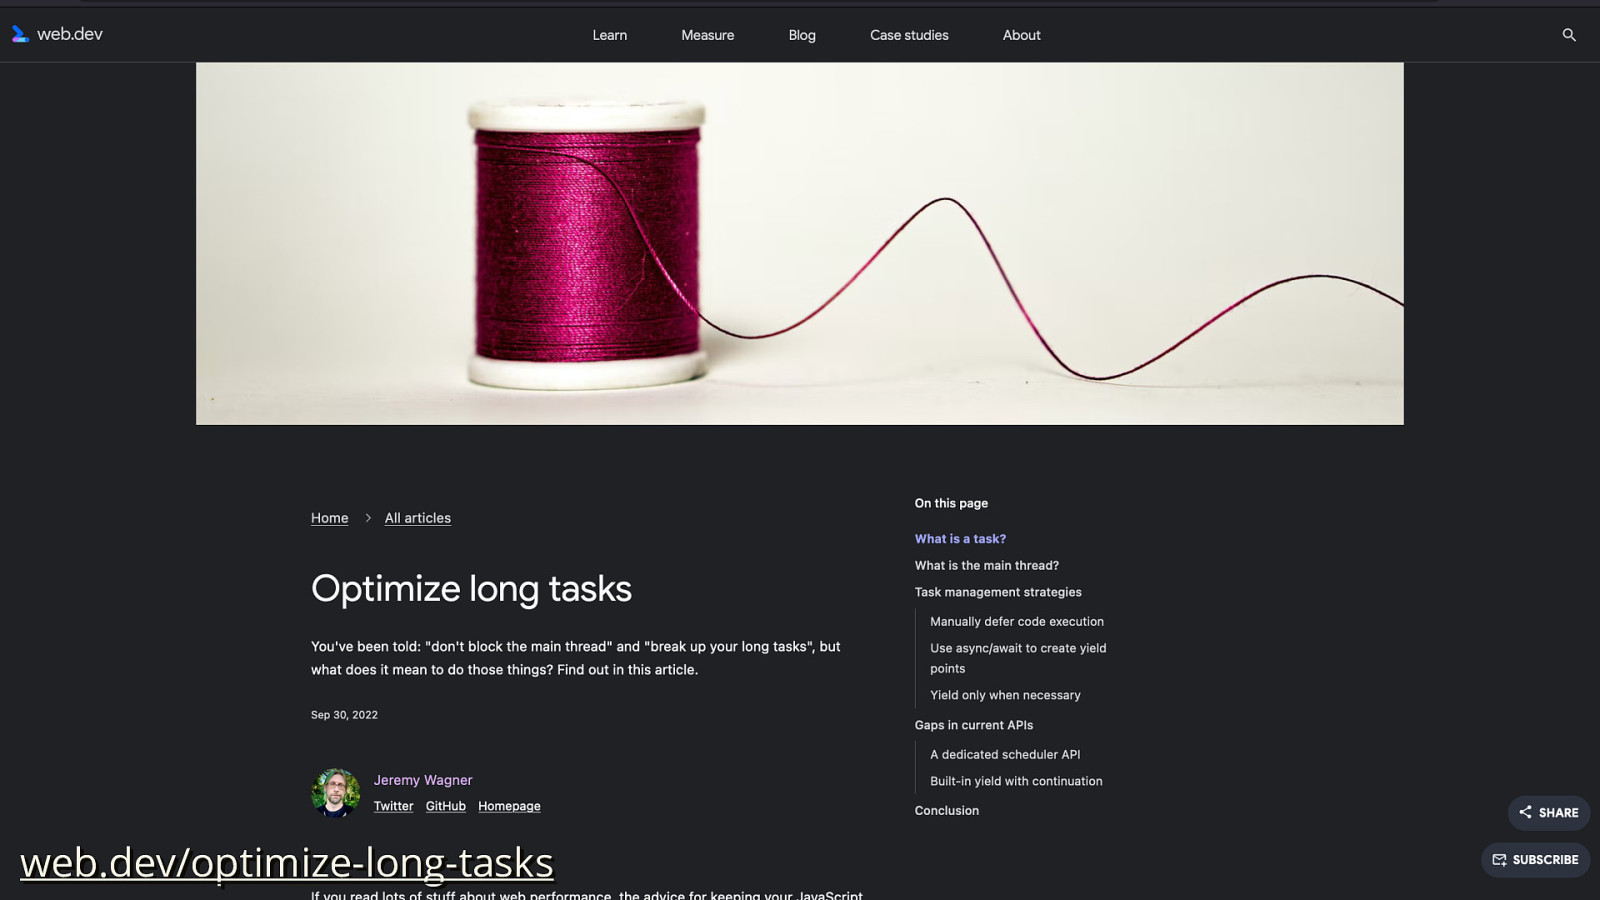
web.dev/optimize-long-tasks The guidance in this section is largely based on an article I just wrote for web.dev, so if you want to get the written version of this, head on over to web.dev/optimizelong-tasks/.
Slide 42
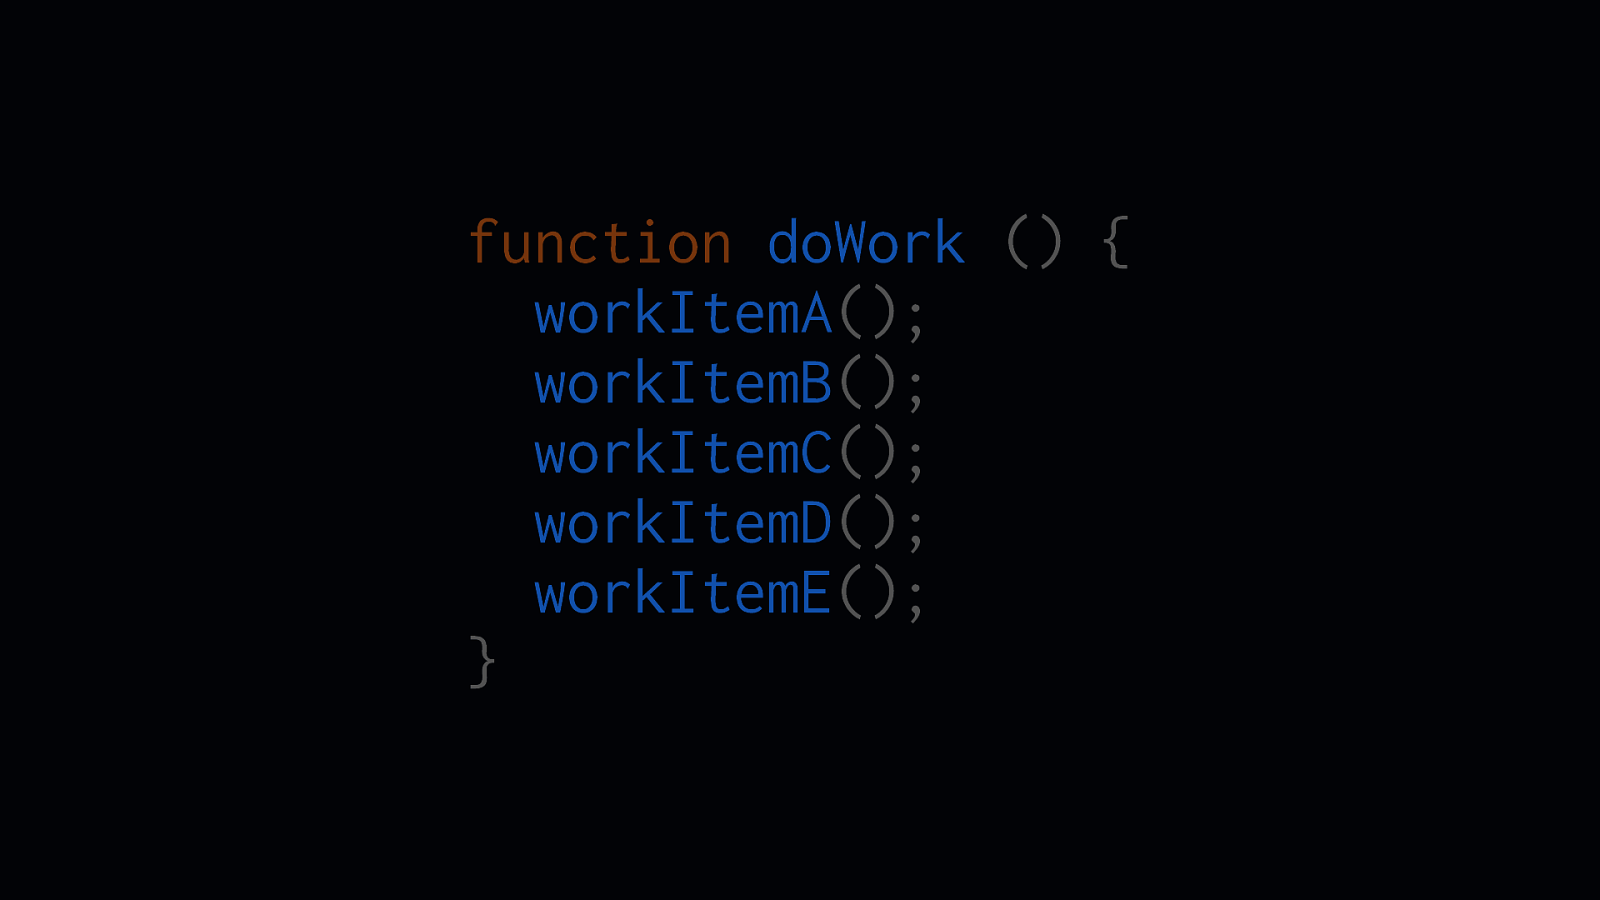
function doWork () { workItemA(); workItemB(); workItemC(); workItemD(); workItemE(); } One good piece of advice developers tend to follow is to split up work into separate functions. We do this for a number of reasons, such as maintainability, readability, and testing. It’s easier to follow, and we get to isolate work to separate little function-y units.
Slide 43
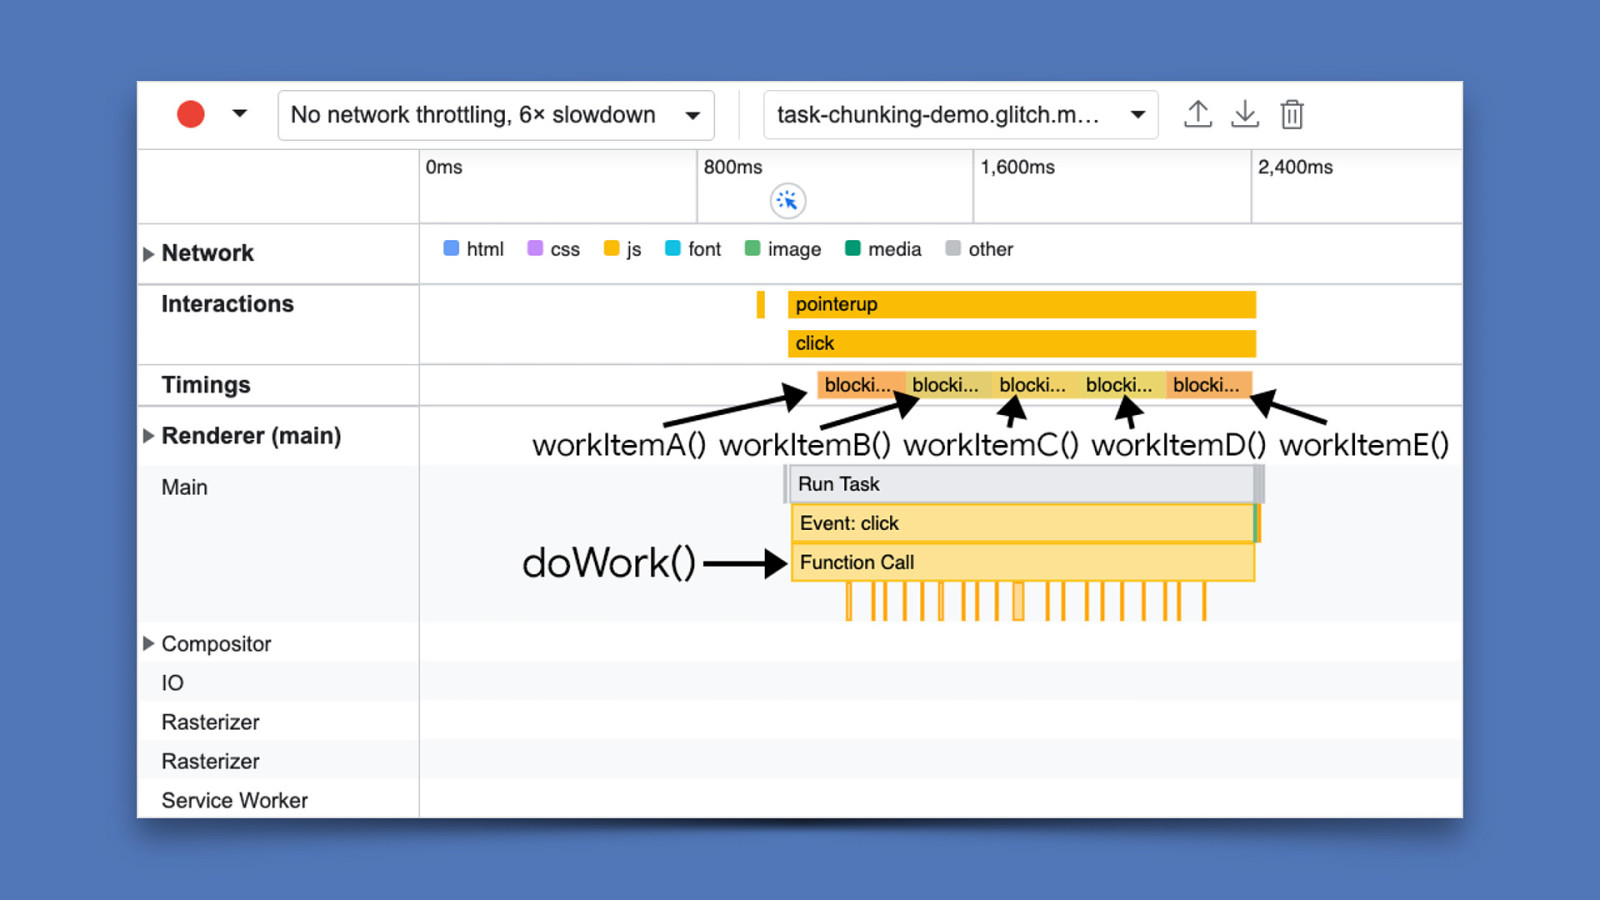
However, where JavaScript is concerned, because all of the workItem functions are executing in the same function, it will group all of that work into a single, longrunning task. That’s not great from a performance standpoint, because instead of ve little functions just doing their own thing in their own tasks, you have a big ol’ task that will block the main thread from doing new work—including work that occurs because of user interactions.
fi
ff
This will a ect your INP if users are trying to interact with your website. You need to break it up!
Slide 44
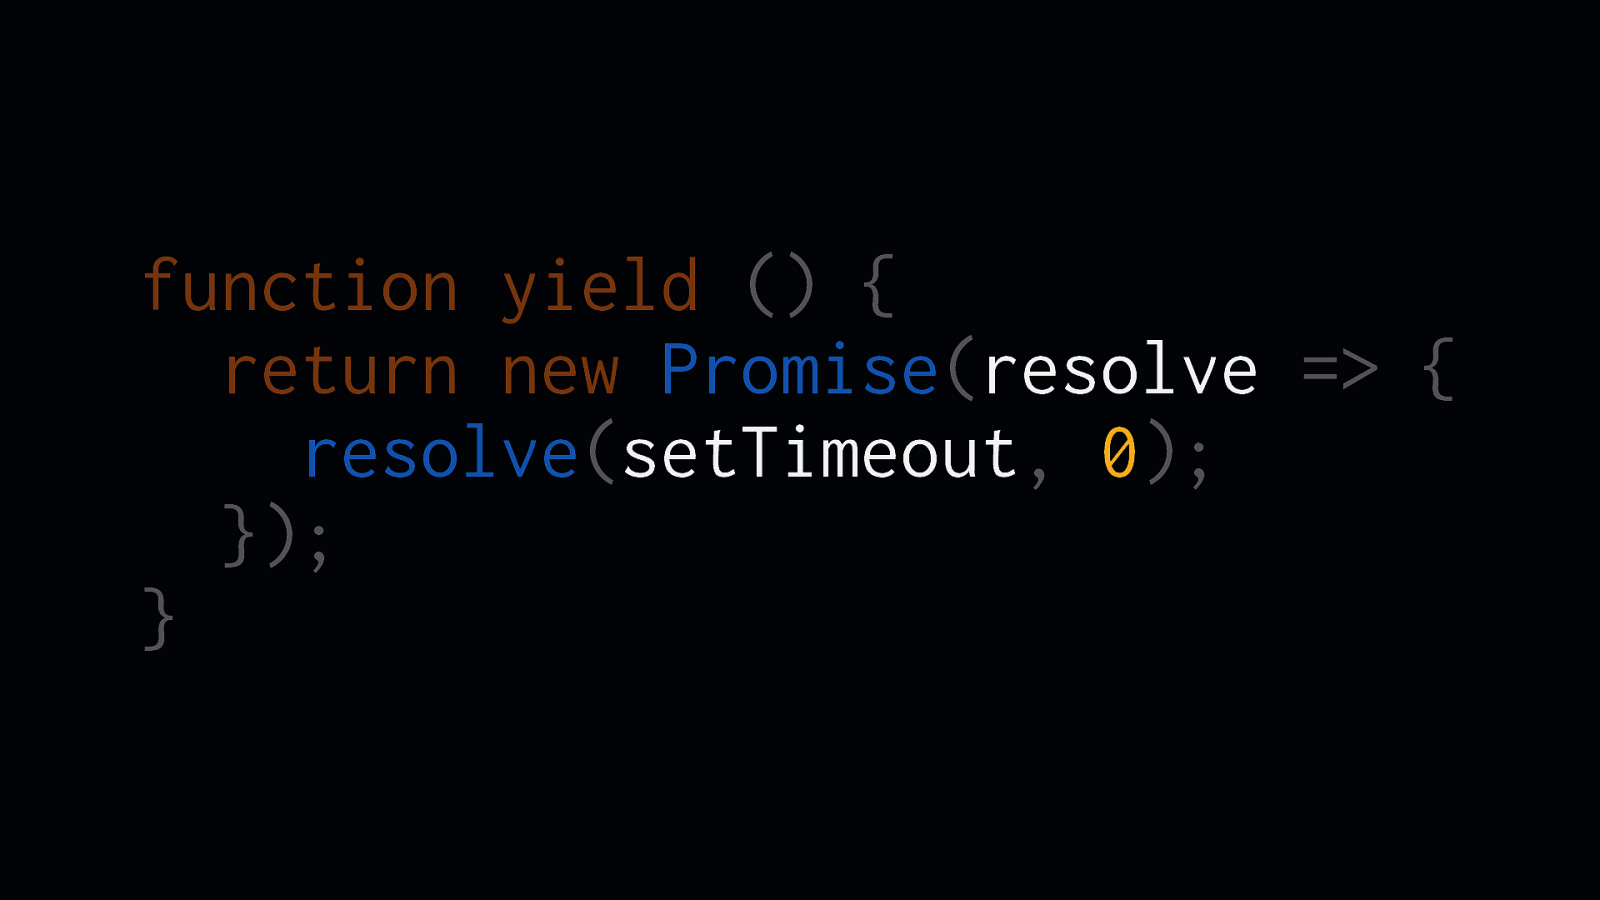
function yield () { return new Promise(resolve => { resolve(setTimeout, 0); }); }
One way to do this is to yield to the main thread, which breaks up tasks. Take this homemade yield function: It uses a promise that resolves with a call to setTimeout— this works because setTimeout will schedule its callback in a new task.
Slide 45
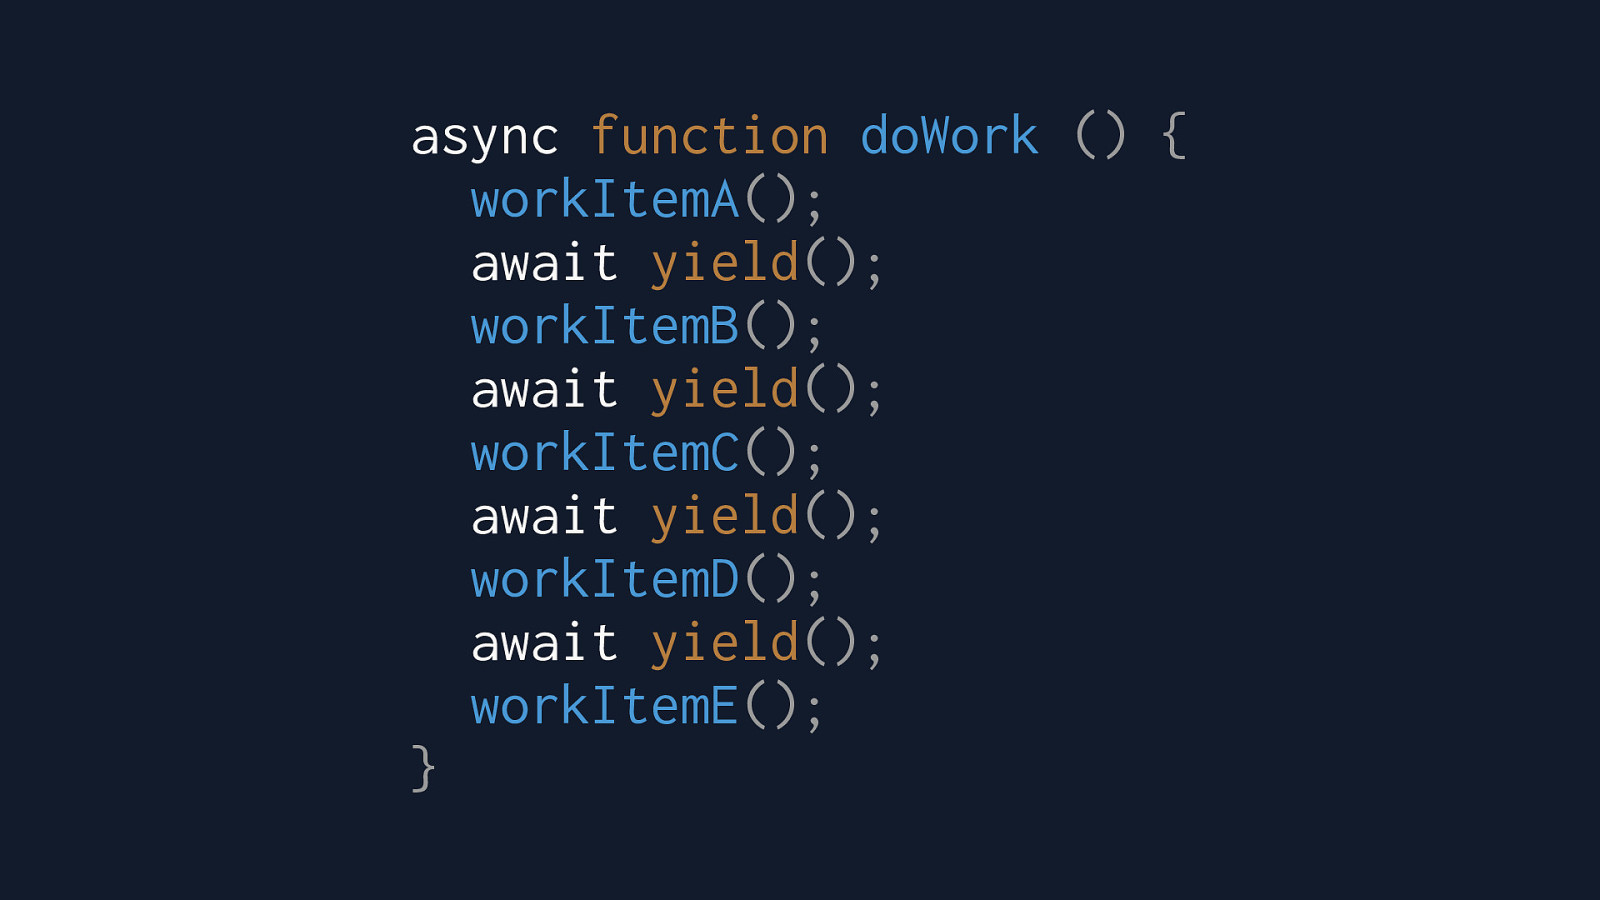
async function doWork () { workItemA(); await yield(); workItemB(); await yield(); workItemC(); await yield(); workItemD(); await yield(); workItemE(); }
With that yield function, you can then yield to the main thread after every little discrete piece of work by awaiting the custom yield function. Note that you don’t have to yield after every function. For example, if you have critical work that updates the UI, you can yield after those functions to give the renderer a chance to do that work.
Slide 46
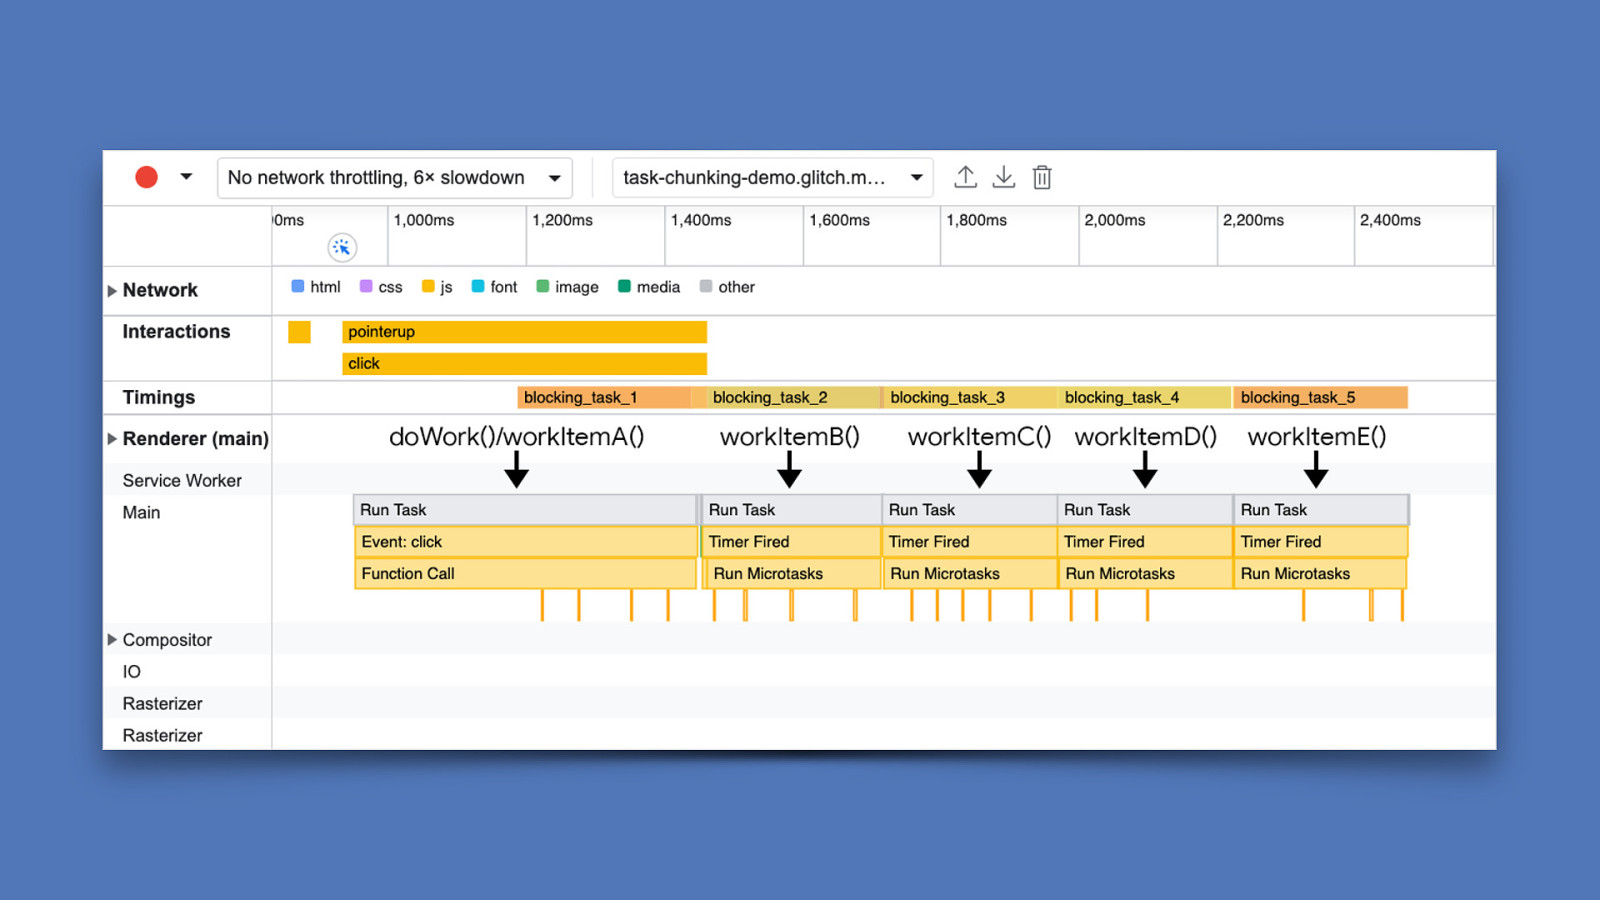
The result instead is that you don’t have one giant task that has to run every little function, but a task for each separate function. This gives the main thread more opportunities to yield to other things—things like other interactions, or background work the user doesn’t necessarily see.
Slide 47
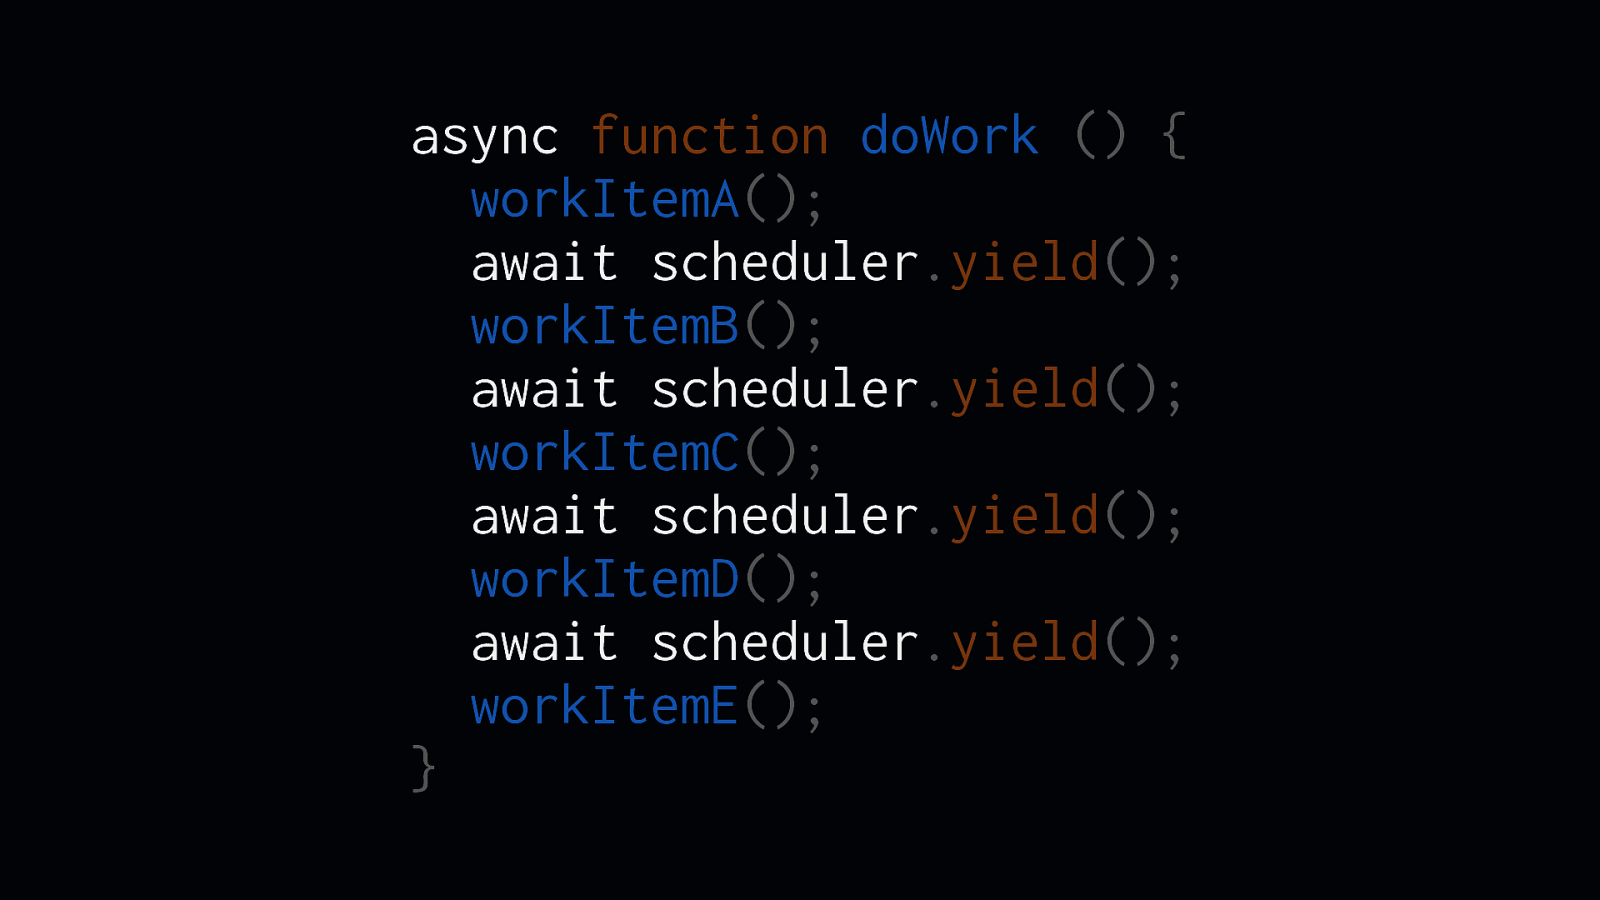
async function doWork () { workItemA(); await scheduler.yield(); workItemB(); await scheduler.yield(); workItemC(); await scheduler.yield(); workItemD(); await scheduler.yield(); workItemE(); }
Is this approach a bit hacky? Maybe—but there could be a better solution in the future. [ADVANCE] One proposed part of something called the Scheduler API is scheduler.yield, which will work much the same way as the promise-based solution I’ve shown you, but will allow developers to tell browser directly if the current task should be broken up and yield to the main thread at speci c points.
fi
I’m excited for this potential addition to the web platform, as it will give developers a way to break up work without userland hacks.
Slide 48
You still need to do as little work as possible. But I should take this time remind you of one very important thing: breaking up work still isn’t enough on its own—remember: INP is all about time. Time it takes to present the next frame. If you have a ton of little tasks that are running all the time, or lots of huge tasks that are blocking the main thread, you can’t present the next frame after a user interacts with a page as fast as you might need to. You still need to do as little work as possible.
Slide 49
Yield to user input.
Another way to prioritize user-facing work is to explicitly yield to user interactions with the isInputPending method.
Slide 50
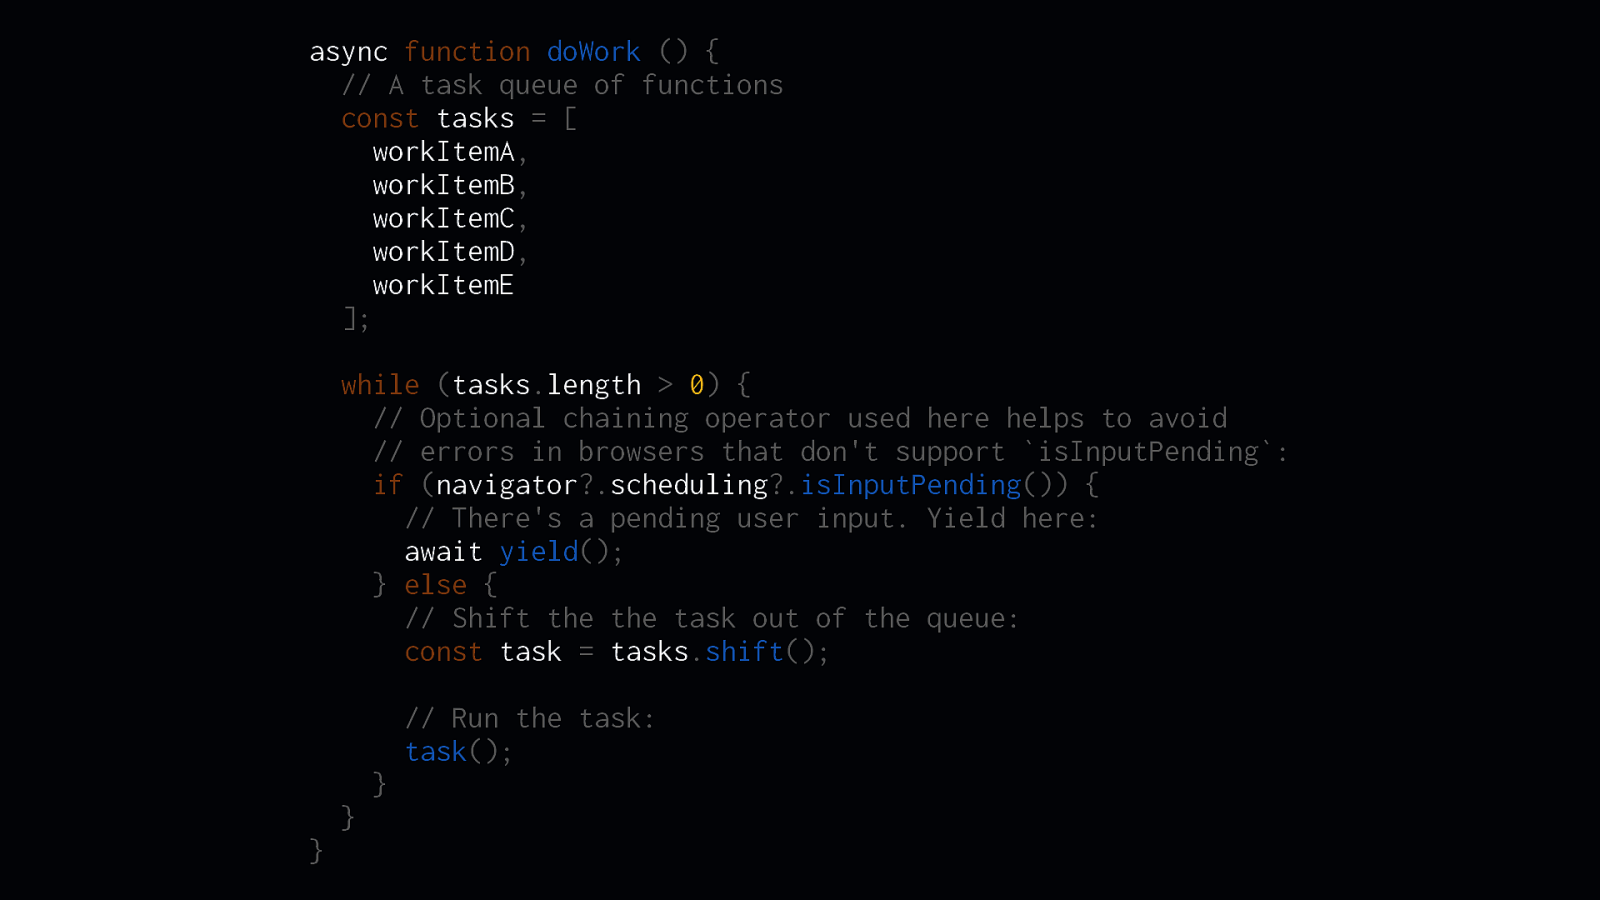
async function doWork () { // A task queue of functions const tasks = [ workItemA, workItemB, workItemC, workItemD, workItemE ]; while (tasks.length > 0) { // Optional chaining operator used here helps to avoid // errors in browsers that don’t support isInputPending: if (navigator?.scheduling?.isInputPending()) { // There’s a pending user input. Yield here: await yield(); } else { // Shift the the task out of the queue: const task = tasks.shift(); // Run the task: task(); } } }
isInputPending is available in navigator.scheduling.isInputPending, and it returns a boolean if the user has interacted with an element on the page.
ff
In this code, you can see how the doWork function adds separate functions to an array of tasks. Then, within a while loop, this code checks if there is a pending user input. If so, we explicitly yield to the main thread so that interaction can take place. Otherwise, we shift the next task o the front of the tasks array and run it.
Slide 51
ff
ff
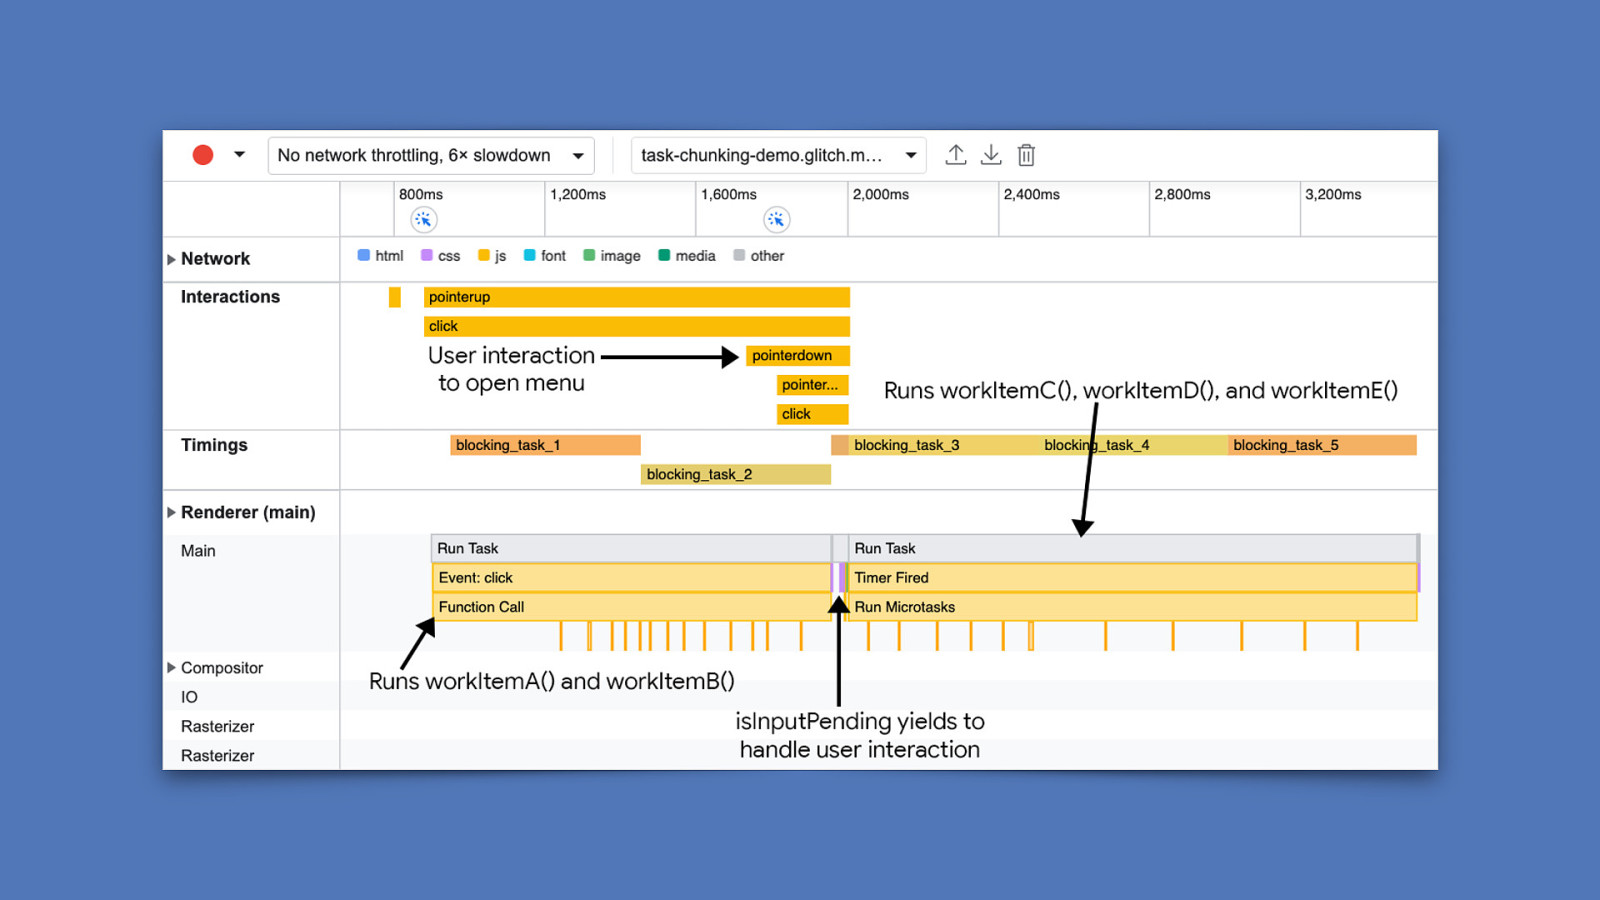
The e ect of isInputPending is evident. Here, we have a large, blocking task that doWork kicks o —however, in the middle of that task, isInputPending is used to see if a pending user interaction is waiting for the main thread, which is brought on by clicking a button to open a navigation menu. When isInputPending returns true, we yield to that interaction and allow the browser to handle it.
Slide 52
Prioritize work. But—there is more you can do—and that involves prioritizing tasks. When using this strategy, you should think of tasks in terms of what’s critical and user-facing, and what isn’t visible or immediate.
Slide 53
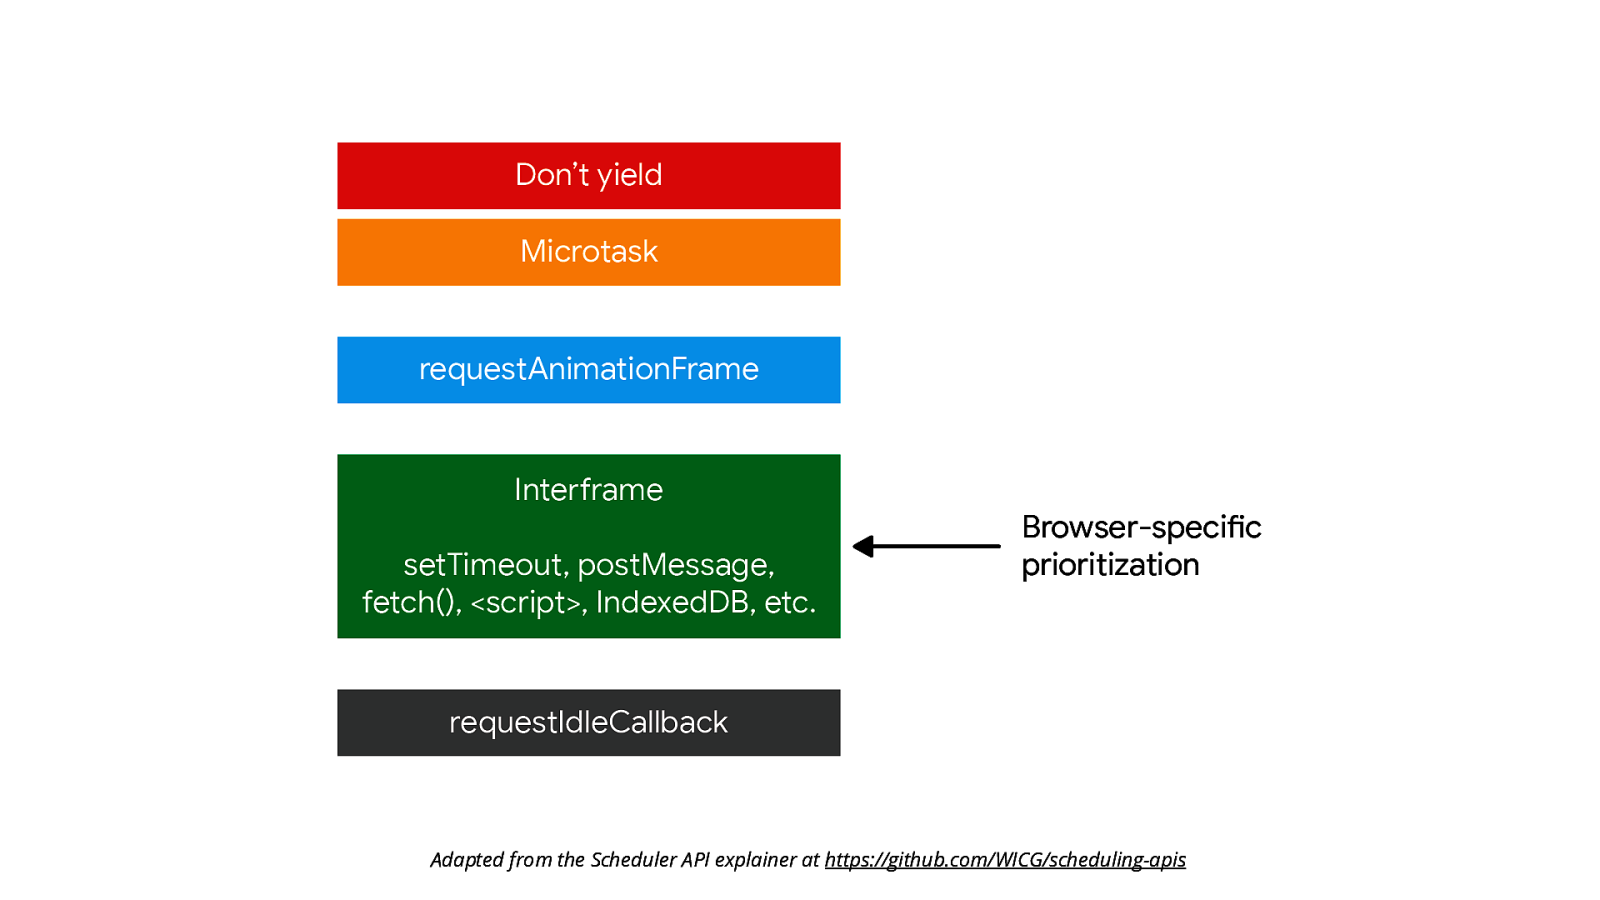
Adapted from the Scheduler API explainer at https://github.com/WICG/scheduling-apis fi This gure shows how browser prioritization of tasks works by default. When you leave things up to the browser, it will try to prioritize inputs based on a system of internal priorities. It works pretty well, but sometimes it needs… a nudge.
Slide 54
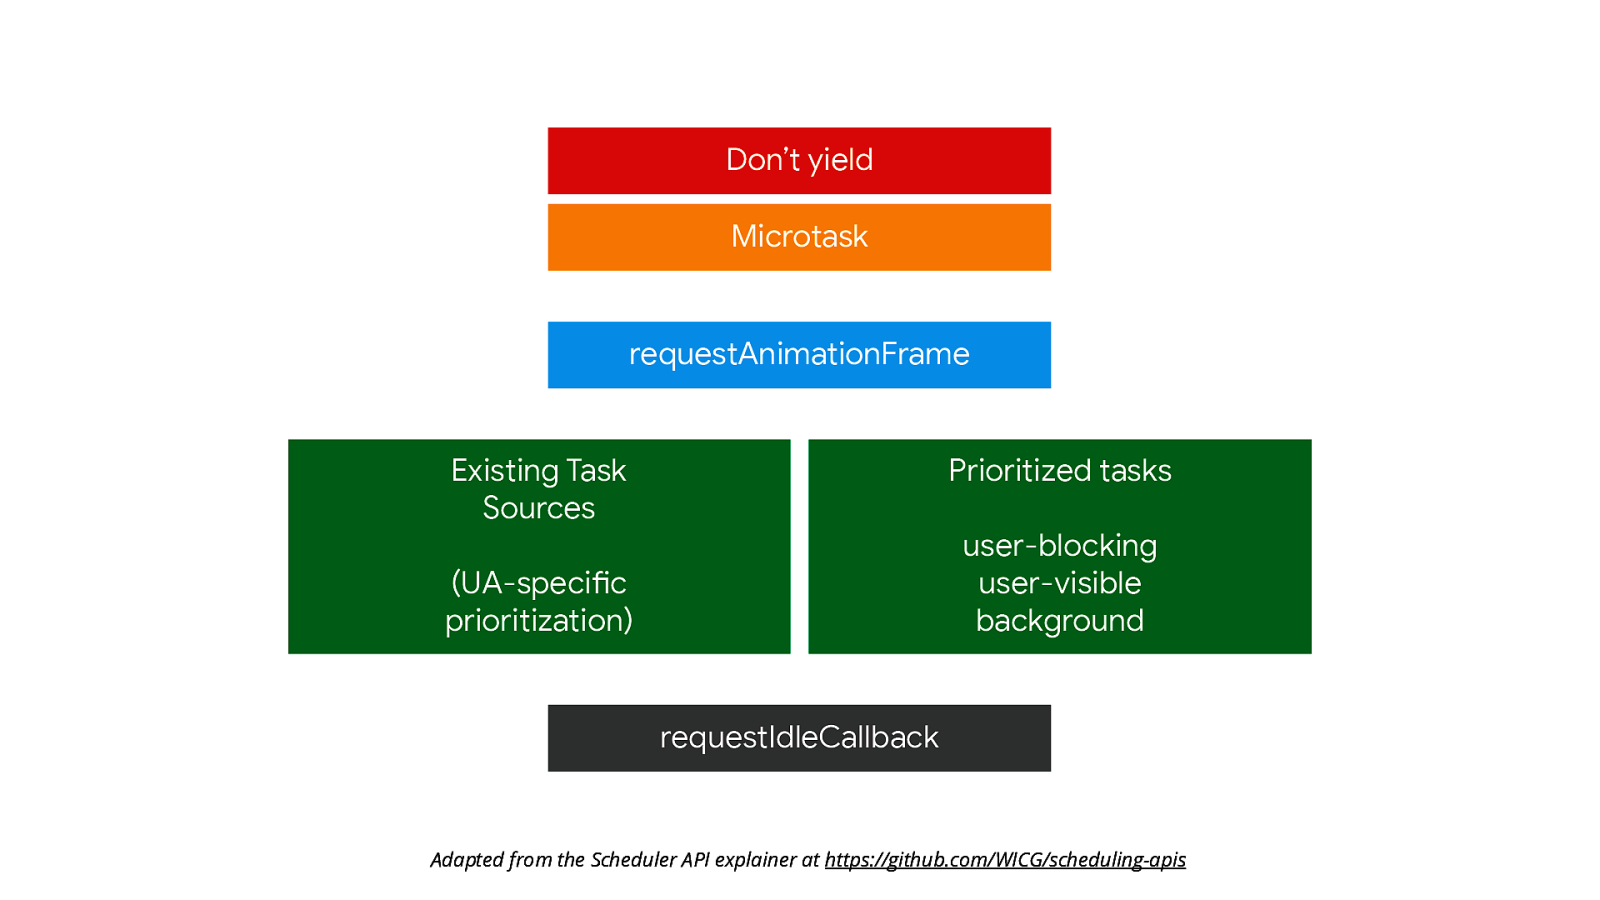
Adapted from the Scheduler API explainer at https://github.com/WICG/scheduling-apis
The postTask API—currently only supported in Chromium browsers and Firefox behind a ag—adds more exibility to how browsers can schedule work. More importantly, it allows the developer to schedule work based on a system of three priorities:
fl
fl
"user-blocking"which is for critical work that must run at high priority. Think of this priority as best for interactions that need to be processed as soon as possible. 2."user-visible"which is for medium-priority work that may result in visual changes to the user interface, but maybe isn’t strictly critical. 3."background"which is for low priority work.
Slide 55
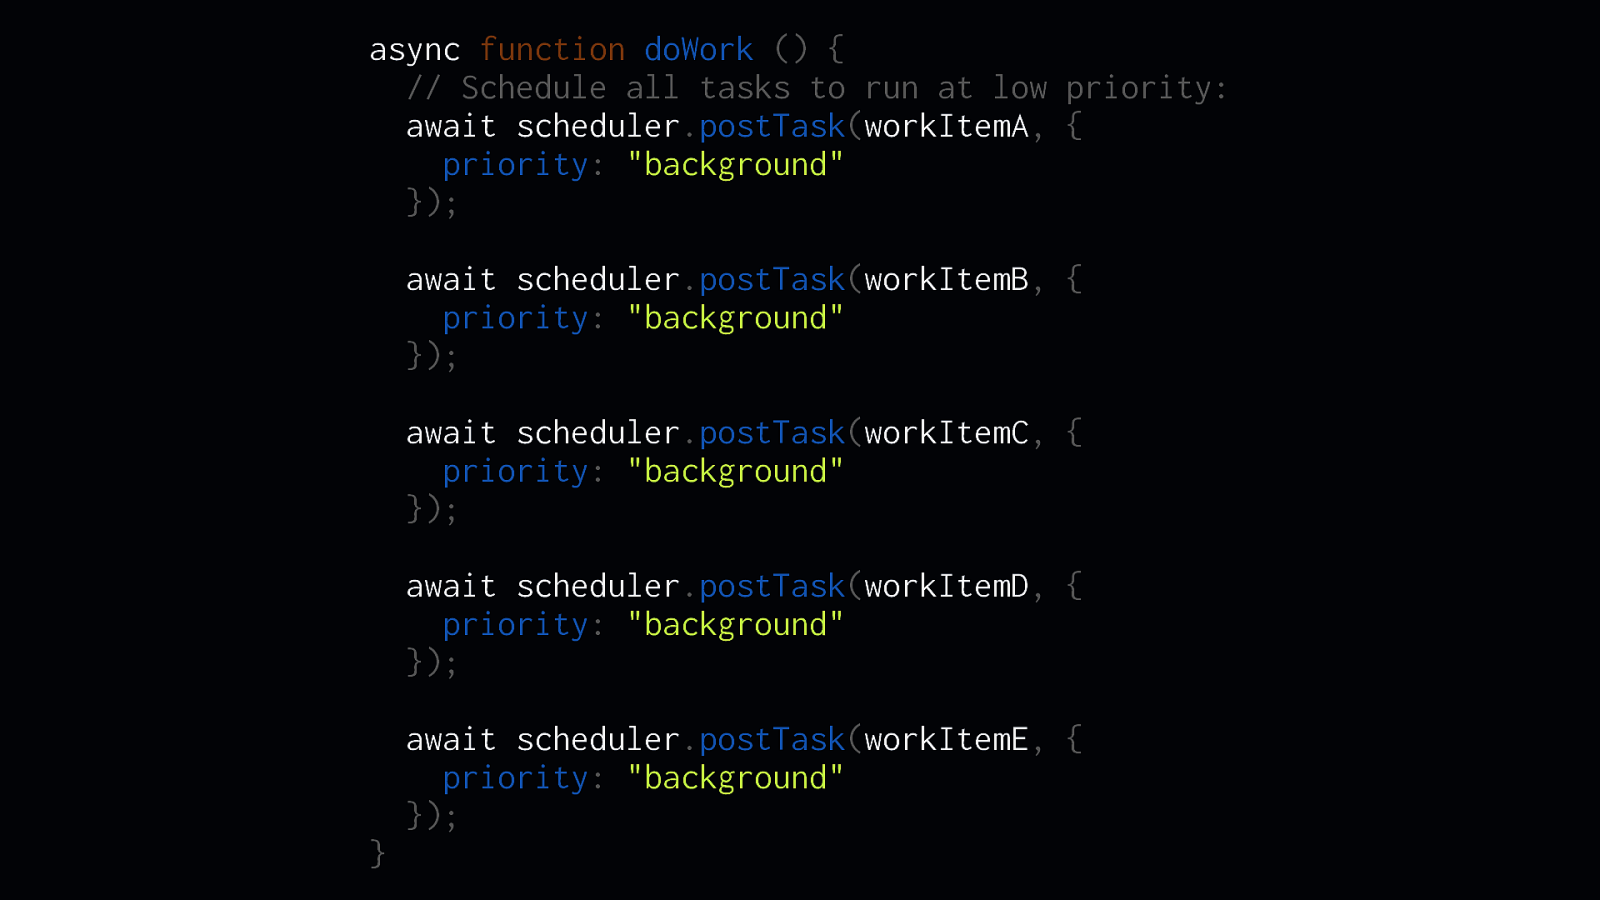
async function doWork () { // Schedule all tasks to run at low priority: await scheduler.postTask(workItemA, { priority: “background” }); await scheduler.postTask(workItemB, { priority: “background” }); await scheduler.postTask(workItemC, { priority: “background” }); await scheduler.postTask(workItemD, { priority: “background” });
}
await scheduler.postTask(workItemE, { priority: “background” });
Let’s say you have a bunch of work that doesn’t result in any changes to the user interface. This would be background work. The shape of the postTask API allows you specify a priority value using one of the priorities I mentioned previously. In this case, all the tasks are set to run at “background” priority.
Slide 56
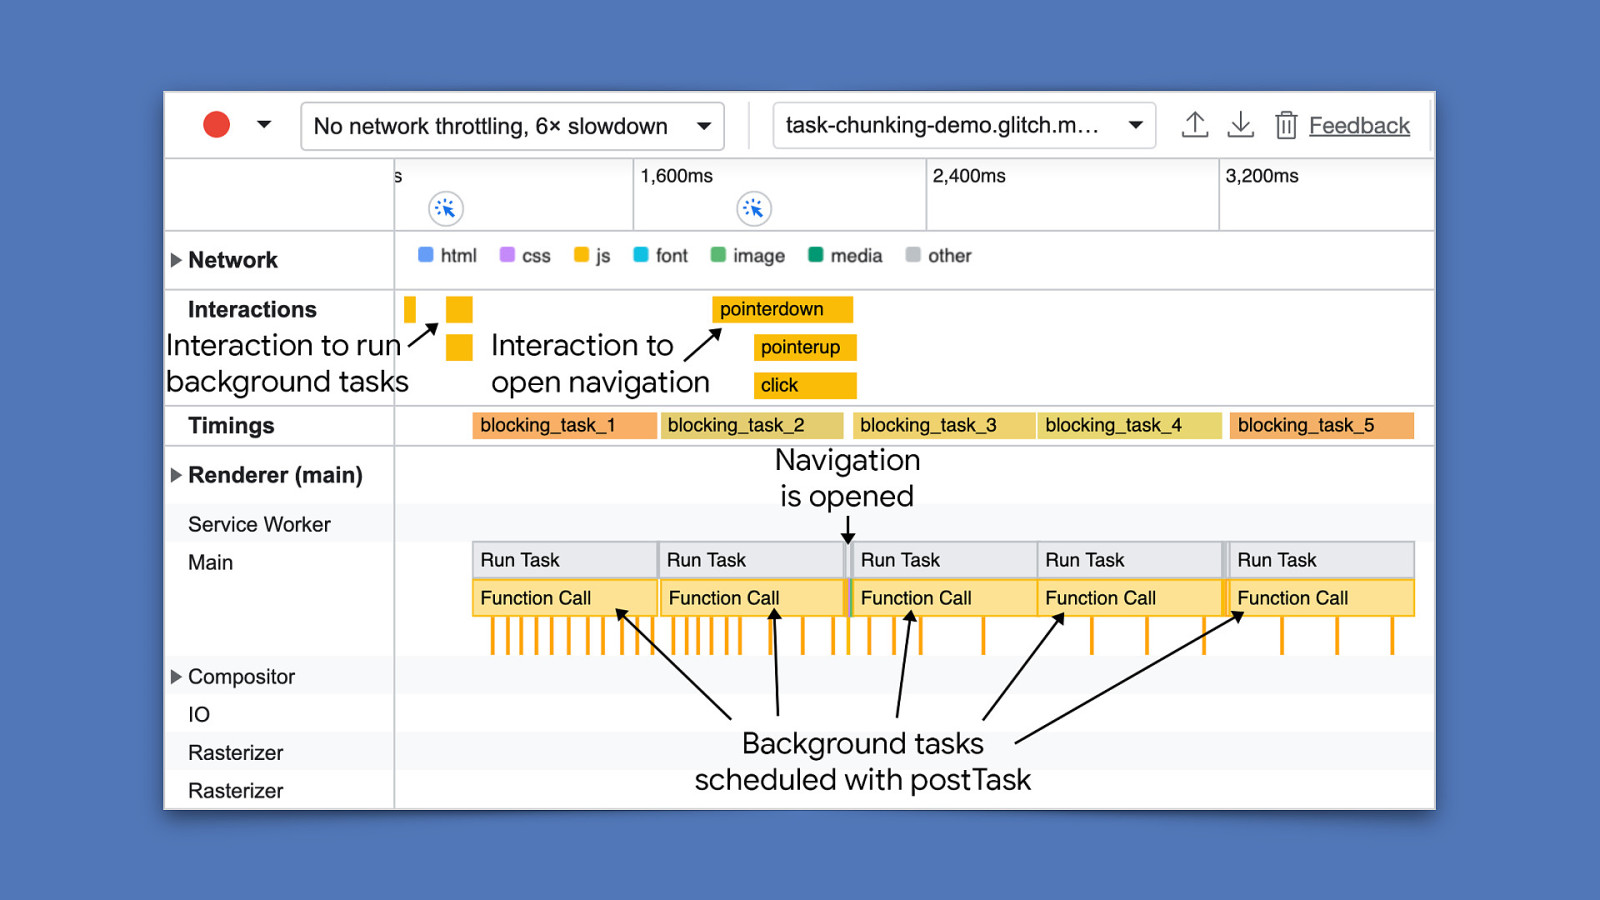
Now let’s say you run that work, and then the user interacts with the page to open a navigation menu, for example. The background work will run at lower priority, but if the user opens the navigation menu, those background tasks will yield to the interaction.
fi
This API is exciting—but even more exciting is that it’s still developing. There are discussions currently taking place about adding ner-grained priorities, as well as other mechanisms—such as the scheduler.yield() functionality I mentioned earlier.
Slide 57
INP is evolving. fi fi On a nal note, I feel it’s important to make it clear that INP is a developing metric. The Chrome Speed Metrics Team at Google is still ne-tuning this metric. So some of what I said in this talk may change, but the fundamentals should still hold true in the future.
Slide 58
Thank you for your time. Jeremy Wagner — jlwagner.net — @malchata — Armada JS If you have any questions about INP, feel free to ask me in the hallway. I don’t know everything, but I’ll try my best to answer any questions you might have. I will also tweet the link to my slides soon, which you can see shortly on my Twitter pro le @malchata—that’s M-A-L-C-H-A-T-A. fi And with that, thank you for your time, and for hosting me. This conference is one of my favorites, and I’m glad I got to do it again.